
Gross national income per capita of different countries of the world varies a good deal and further that there exists a large income or development gap between the developing and the developed countries. It is important to explain how income inequalities between various countries in the world economy are exactly measured. However, methods of measuring income inequalities between countries are the same as the methods used for measuring inequalities within countries.
Following are the methods of measuring inequalities within countries:
1. Absolute Income Method:
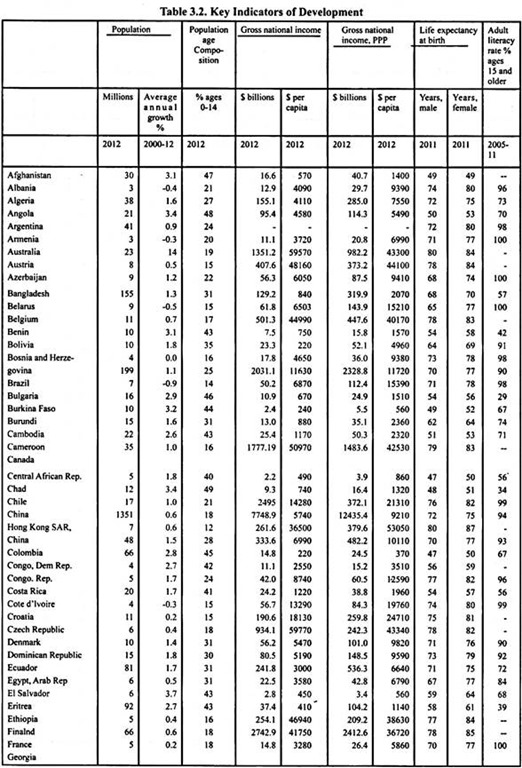
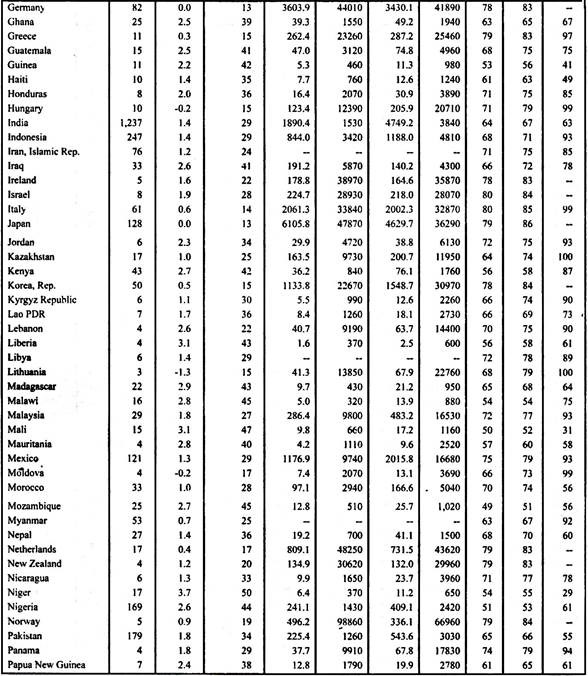
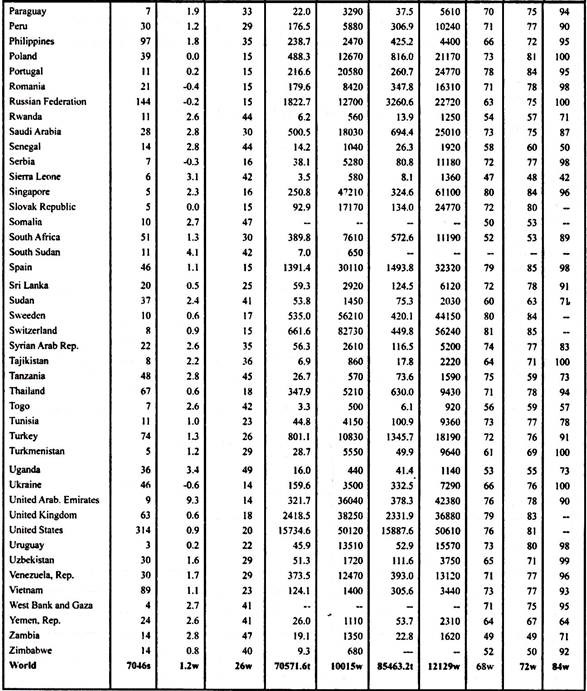
This is the simplest method of measuring international income inequality. In this we measure absolute income gap or range between the richest and poorest countries. From Table 3.2 we find that gross national income per capita based on purchasing power parity (PPP) prices for the year 2012, the poorest country is Democratic Republic of Congo with $ 370, whereas the GNI per capita of the richest country Norway is $ 66960 in 2012.
Thus, absolute income gap is $ 66960 – $, 370 = $ 66590. In this case if the two countries grow at the same rate, the absolute income will grow. For example, 1 per cent growth rate will roughly add to Norway’s per capita income by $ 670 whereas one per cent growth will cause only $ 3.7 increase in per capita income of Democratic Republic of Congo.
ADVERTISEMENTS:
In this case Congos would have to grow more than 600 per cent so as to narrow the absolute income gap between itself and Norway. However, this absolute income method of measuring international income inequality underestimates the degree of income inequality between them because it compares only the average incomes of the poor and rich countries. If actual income per capita of the poorest people of the poor countries is compared with income per capita of the richest people in rich countries, the income gap will be much greater.
2. Relative Income Method:
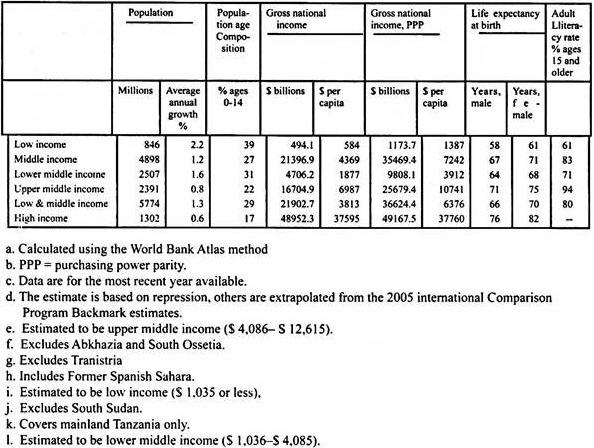
In this method of measuring income inequality in the world economy instead of measuring the absolute income gap, the ratio of income per capita of the low income countries to the per capita income of the high income countries is found. In the data given in Table 3.3 average income per capita of low income countries in terms of purchasing power party (PPP) prices is $ 1,387 whereas the average income per capita of high income countries is $ 37,760.
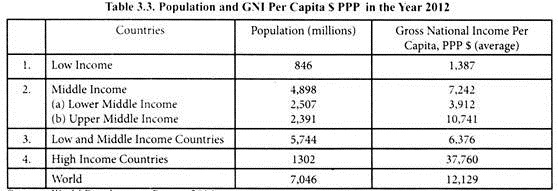
Therefore, the relative income ratio in the present case is $ 37,760/1,387 = 28.1. From the relative income ratio it follows that to narrow the gap; poor countries have to grow faster than the richest countries. East Asian countries, Taiwan, South Korea, Hong Kong, Singapore, recorded much higher growth rates of around 6 to 7% in per capita income between 1965 and 1990 as compared to the rich countries and therefore succeeded in reaching the level of rich countries.
ADVERTISEMENTS:
In the last over two decades, China and India have registered a very high growth rate in per capita income and have narrowed the relative income gap with the rich developed countries. It is now estimated that if India maintains its 8% growth in total GDP it will reach the rank of high income developed countries by the year 2050 and will thus catch up with them.
3. Lorenz Curve and Gini Index:
The most popular method of measuring international income inequality is to draw a Lorenz curve which in the present context relates to the distribution of income corresponding to the distribution of population across countries or groups of countries. It is worth mentioning that in this method international income inequality is measured in two ways.
In the first method, international income inequality is measured treating each country as a single unit and giving equal weight in the measure. In the second method of measuring international income inequality though each country is treated as a single unit in the measure but is weighted by its size of population.
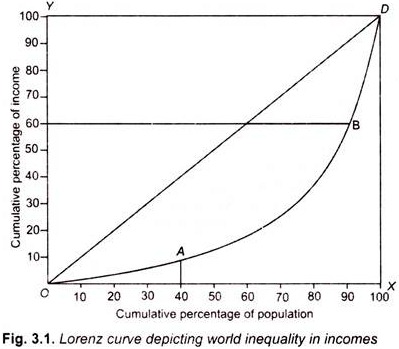
To draw Lorenz curve depicting distribution of income we first rank each country or groups of countries in ascending order of the percentage of gross national income of the world income they have and percentage of world population possessed by them. Then, to draw Lorenz curve in a figure we measure cumulative percentage of income of countries on the Y-axis and cumulative percentage of their population on the X-axis. By drawing so we get a box as shown in Fig. 3.1.
The diagonal line OD represents the line of perfect equality. Now, with given data of Gross national income (based on PPP $) of various countries and their populations, such as given in Table 3.2, we can draw a Lorenz Curve by plotting the cumulative percentage of income of the countries in ascending order and the cumulative percentage of their populations. Such a Lorenz curve OABD has been drawn in Fig. 3.1. According to this cumulative 10 per cent of world income of the countries have 40 per cent of world population and cumulative 60 per cent of incomes of the countries contain 90 per cent of populations is represented by point A.
Needless to say, 100 to per cent cumulative income of all countries would correspond to 100 per cent of world population. The Lorenz Curve OABD roughly represents the data of gross national income (GNI) based on PPP $ of various countries and their populations in the year 2012 given in Table 3.2. As will be seen, Lorenz curve OABD is much far away from line OD of perfect equality. This shows that there is a very high degree of international income inequality.
ADVERTISEMENTS:
4. Gini Index or Gini Ratio:
Gini Index which is widely used both for measuring international income inequality and income inequality within individuals countries is based on Lorenz curve measure as represented by curve OABD. Gini index is the ratio of the shaded area within the Lorenz curve OABD to the total area OXD. The greater this area, the higher will be the value of Gini Index.
5. Standard Deviation and Coefficient of Variation:
These are also important measures of inequality. Standard deviation measures the square root of average of the sun of squared deviations of each country’s per capita income from the mean income of all countries. Symbolically it is written as –
ADVERTISEMENTS:
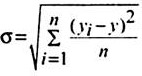
Where σ stands for standard deviation,y1 is income of a country, y̅ is mean income of all countries and n is the number of countries included in the sample.
Having calculated standard deviation (σ), coefficient of variation can be obtained by dividing the standard deviation by the mean of the sample (y̅). Coefficient of variation normalises the standard deviation as there is positive correlation between the mean and standard deviation.
Catching up with Developed Countries:
ADVERTISEMENTS:
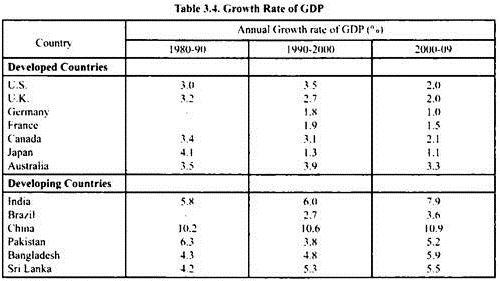
In fact, the developing countries have been growing much faster than the developed countries in the past three decades as will be seen from Table 3.4 where the growth rates of GDP for some selected developed and developing countries for 1980-90, 1990-2000 and 2000-09 are given. For example, whereas China’s GDP has been growing at more than 10 per cent in all these decades and India’s annual GDP growth was 5.8% in 1980-90, 6.0 per cent in 1990-2000 and 7.9 per cent in 2000-09.
China has been the fastest growing economy of the world and India is the second fastest growing country of the world. If they maintain this growth momentum, they will catch up with the present-day high per capita income countries. Newly industrialised countries (NIC) such as Taiwan, South Korea, and Singapore through higher economic growth after the fifties have joined the rank of high per capita income countries.
Further, according to International Comparison Progress (ICP) report of World Bank released in April 2014, the global economy balance seems to be tilting towards the developing countries.
It will be interesting to note that India has overtaken Japan to emerge as the third largest economy of the world in terms of total GDP based on purchasing power parity (PPP $) terms after the U.S. and China according to the latest (2011) data of World Bank (ICP). Share of twelve largest economies of the world’s GDP as per World Bank’s ICP 2011 report is given in Table 3.5. It will be seen from Table 3.5 that with 17.1 per cent of share of world’s GDP the United States remains world’s largest economy followed by China with 14.9 per cent share in world’s GDP and India with 6.4 per cent share of world’s GDP.
The previous version of the World Bank’s International Comparison Progress (ICP) report had said that India was ranked 10th in 2005 in terms of PPP. PPP $ is used to compare economies and incomes of people by adjusting for differences in prices in various countries. The economies of Japan and the U.K. became relative to the U.S. while Germany increased slightly and France and Italy remained the same.
ADVERTISEMENTS:
Further, the World Bank ICP report 2011 said that six of the world’s largest economies were in the middle income per capita category. The dozen largest economies accounted for two-third of the world economy and 59% of the population. The six largest middle income economies, China, India, Russia, Brazil, Indonesia and Mexico, accounted for 32.3 per cent of world GDP, while the six largest high income economies – U.S., Japan, Germany, France, UK, Italy – accounted for 32.9% showing that emerging economies had reduced the gap through rapid growth in recent years.
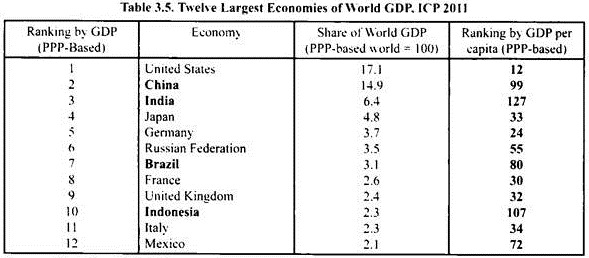
It is important to note that a number of largest economies in terms of GDP are not the richest in terms of GDP per capita as can be seen in Table 3.5 from their ranking of their GDP per capita. For example, India is 3rd largest economy but its ranking in terms of GNP per capita is 127th. This is due to its large population which reduces its per capita GDP. The same is the case of China. Despite its second largest economy in respect of the size of its total GDP, its ranking in GDP per capita is 99th only. Both India and China have per capita GDP in the middle income category and are designated as developing countries.
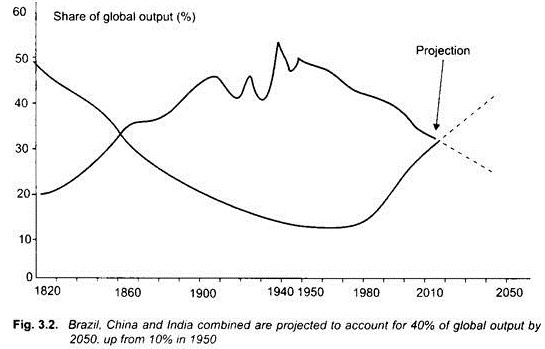
It is worth mentioning that most developing countries have done well in respect of rate of economic growth (Table 3.5), a good number of countries have done particularly well and therefore 2013 Human Development Report calls it as “the rise of the south” (South means developing countries). According to this 2013 Human Development Report, the combined output of the developing world’s there economic powers, China, India and Brazil together represented only 10% of the world economy (i.e., world’s GDP) in 1950, while six traditional economic leaders of the North (i.e., developed countries) accounted for more than half.
According to projections made in this report by 2050 (the combined outfit of the three leading developing countries alone – China, India and Brazil – will account for 40 per cent of global output surpassing the aggregate production of present-day’s group of six developed countries – Canada, France, Germany, Italy, the United Kingdom and the United States (see Fig. 3.2). What is significant to note is that according to this report “much of the expansion in output in these countries is being driven by new trade and technology partnership within the south itself’
Higher Levels of Inequality and Poverty:
ADVERTISEMENTS:
In the analysis of international income inequality above it is found that there is a very large gap between the per capita income of the rich and poor countries. However, to fully know the causes of poverty in developing countries, it is necessary to know the extent of inequality in income distribution within the developing countries. In general it is found that in poor developing countries there are large inequalities of income within them.
Thus, it is important to mention that the problem of poverty of the people in poor developing countries is not only due to their lower average per capita income as compared to the rich countries but also there exists larger inequality in the distribution of income within them. Prof. Debraj Ray rightly writes, “The poor are twice cursed- once for living in countries that are poor on average and then again for being on the receiving end of the high levels of inequality in those countries”. Income inequalities also exist in rich developed countries, but in developing countries where along with average low level of per capita income large inequality in income distribution leads to the acute problem of absolute poverty and destitution.
In several African countries such as South Africa, Lesotho, Sierra Leone, there prevail very high levels of income inequality. In Latin American countries which belong to the group of middle-income countries, large income inequalities are found. Income inequality varies greatly among developing countries. In resources-rich developing countries of Middle East and Sub-Saharan Africa, income inequalities are substantially high.
Table 3.6 gives per capita income and inequality of incomes (as measured by share of poorest 40% and share of richest 20% and Gini Ratio) of low-income, lower-middle income and upper-middle income developing countries and high income developed countries. It will be seen from Table 3.6 that in low-income countries share of bottom 40 per cent of population is around only 15 to 17 per cent and the share of the richest 20 per cent of people is quite high at 47 to 54 per cent. Thus, in low-income developing countries, inequalities of income are quite large.
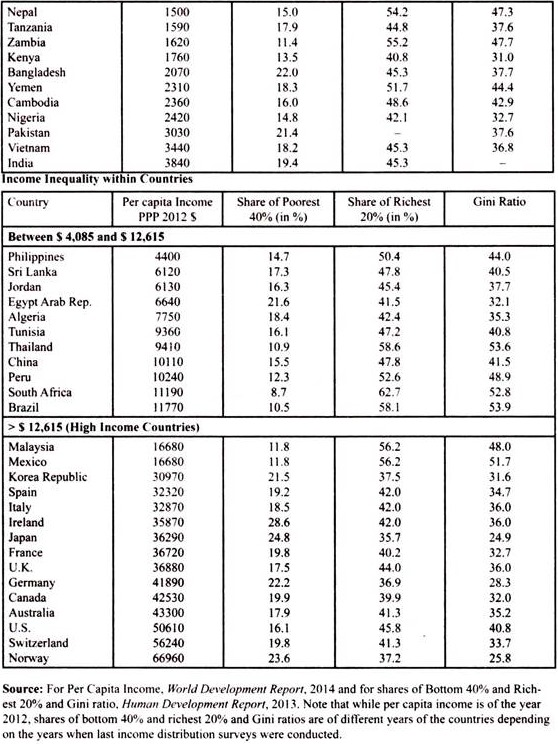
In lower middle-income developing countries except in Bangladesh and India there are large inequalities of income. In India and Bangladesh from the beginning of the 21st century anti-poverty schemes have been started, share of bottom 40 per cent of population has slightly increased lowering somewhat inequalities of income as compared to other lower middle income developing countries but still remain quite large. In India in the survey year 2005 the share of bottom 40 per cent of population was only 19.4 per cent, whereas the share of the richest 20 per cent of the people was quite high at 45.3 per cent.
ADVERTISEMENTS:
The upper middle income developing countries present a mixed picture. In Latin American countries such as Philippines, Peru, Brazil and South Africa, inequalities of income are very large. China which falls in the category of upper-income developing countries, inequality of income is very large; share of the bottom 40 per cent of its people is only 15.5 per cent whereas the richest 20% share is quite high at 47.8%. Gini ratio in case of China is also relatively high (41.5). This shows economic development in China has led to increase in income inequalities.
But a significant fact revealed from Table 3.6 is that except in Latin American country Mexico and natural resource-rich country Malaysia, in high-income developed countries inequality of incomes has declined significantly as judged from the shares of bottom 40 per cent and the richest 20 per cent of their population as well as from the figures of Gini coefficient. However, in the US, income inequality is quite high as in it bottom 40 per cent of its people get only 16 per cent share in national income while the richest 20 per cent get around 46 per cent of national income. This shows that development in the U.S. is quite inequitable and unfair.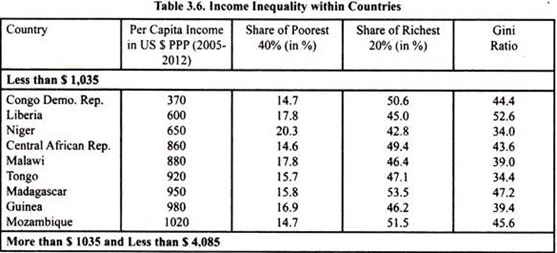
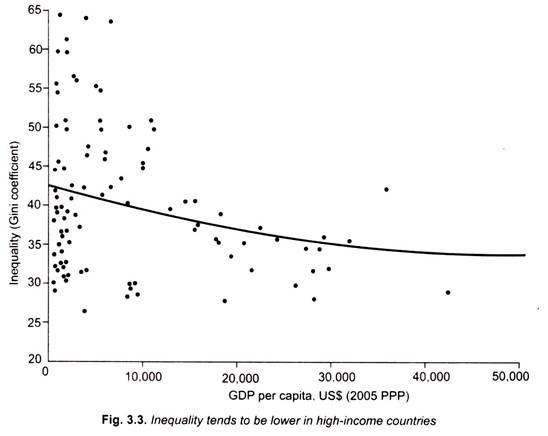
Thus, with the exception of few countries, inequality in income distribution tends to be lower in high-income developed countries. A World Bank study whose results are presented in ‘World Development Indicators, 2013, confirms the conclusion that in high-income developed countries, inequality in income distribution is lower as seen from Fig. 3.3. That is, ultimately with economic development as a country becomes richer inequality of income falls. Thus, in general with economic development beyond middle income status income inequality falls.
It may however be noted that from about $ 5000 till about $ 12000 (in 2005 $ PPP) per capita income World Bank study shows declining income inequality as measured by Gini coefficient but the points representing several countries in the scatter diagram underlying the income-inequality trend curve are quite far away below and above the trend curve implying that up till around $ 12000 per capita income trend curve does not truly represent the situation regarding income distribution. However, with high-income countries whose per capita income exceeds $ 12000 (in $ 2005 PPP), declining trend is quit visible.
The goals of reducing income inequalities and eradicating poverty highlight the need for social, economic and institutional arrangements that foster welfare and income growth of less well-off. However, it needs to be emphasized that the inclusive growth that helps to raise the incomes of the poor (i.e., bottom 40 percent of population) and accelerates progress towards a just society does not come automatically but requires mechanisms to ensure that the poor constituting bottom 40 per cent of the people not only enjoy the benefits of the growth process but are also integral to the process.
Growth can be inclusive if it generates jobs and economic opportunities for the poor and unemployed. This requires adequate investment in physical and human capital accumulation and incentives for the adoption of labour-intensive technologies Evidence also suggests that poverty reduction is higher when growth is biased towards labour-intensive sectors. The government has a key role in creating sustained growth with employment generation and accelerating investment in human capital-education and health of the people-so that the poor are integral part of the growth process.
Poverty:
As explained above, low per capita income along with inequalities in income distribution has given rise to the problem of absolute poverty in low-income and middle-income developing countries. Although poverty has declined rapidly in developing countries since 1980, they still suffer from the large absolute poverty. More than 1 billion people worldwide still live in destitution, a state of affairs that is morally unacceptable, given the resources and technology available today. The World Bank has fixed $ 1.25 a day (2005 $ PPP) and one of its Millennium Development Goals is to reduce this poverty as measured by the people of a country having income or consumption below $ 1.25 a day to 16 % by the year 2015.
Eradicating absolute poverty is one of the most compelling challenges facing the developing countries. Table 3.7 gives the extent of poverty prevailing in developing countries. Eradication of poverty requires not only sustained rate of economic growth but also to ensure there is adequate growth of employment opportunities in industry and services sectors. To ensure that the poor are productively absorbed, the investment by the government in human capital (i.e., education and health) must be stepped up.
Besides, poor must get subsidised food, cooking gas, electricity so that the poor can attain proper level of living and also preventing inequality from increasing. Further, it is imperative that inflation as measured by consumer price index (CPI) number should be checked as inflation makes even essential goods costlier and thereby makes them beyond the reach of the poor.
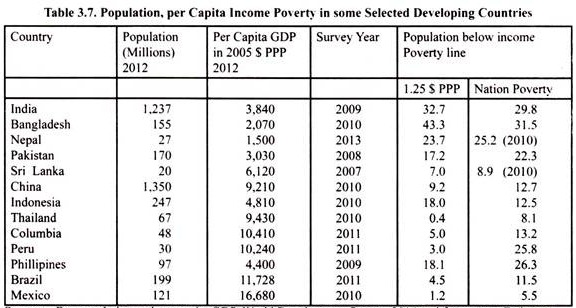
Table 3.7 along with total population and GDP per capita gives the estimates of population living below the poverty line in India and some other selected developing countries both on the basis of international poverty line of 1.25 $ PPP and national poverty line (which varies between different countries depending on their own poverty-line norm). It will be noticed from Table 3.7 (column 5) that on the basis of international poverty line (i.e., 1.25 $ PPP), Bangladesh has the largest ratio of 43.3% of population living below this poverty line.
Next to it, there is India where 32.7 per cent of population lives below this international poverty line. In respect of ‘national poverty’ line Bangladesh tops the list with 31.5 per cent of its population living below the poverty line. Even with regard to national poverty line, India’s place comes next to Bangladesh as in India 29.8 per cent of population lived below the poverty line. This about 30 per cent of India’s population below the poverty line in 2009-10 was based on the poverty line fixed by the expert committee headed by Late Prof. Suresh Tendulkar.
It will be further seen that as compared to India, China has succeeded in reducing its poverty problem as in around 2007-11, its only 13.1 per cent of Chinese population was living below the International Poverty Line of 1.25 $ PPP. Besides, on the basis of ‘national poverty line’ China’s population living below the poverty line has fallen to a more 2.8 per cent. The dramatic fall in poverty in China has been attributed to labour intensive higher rate industrial growth.
Furthermore it will be observed in other developing countries such as Nepal, Pakistan, Sri Lanka, Indonesia and Thailand percentage of population living below the International Poverty Line is very less as compared to that of India. In case of developing countries (Peru, Philippines, Brazil, and Mexico) of Latin America, the incidence of poverty is also low. In Brazil, which is also one of BRICS country, 6 per cent of population lived below the line on the basis of international poverty line of 1.25 $ PPP in the period 2007-11.
The issue of poverty estimates has been a subject of heated debate many people have questioned the ‘low poverty line’ used by the Tendulkar Committee to find that in 2009-10 around 30 per cent of India’s population lived below the poverty line (which is absolute number amounts to 350 million people).
However, even these poverty numbers based on relatively low poverty line are of quite enormous size and indicate the appalling living conditions of the poor in India Jean Dreze and Amartya Sen slightly suggest that “It is all the more important to explore possible ways of extending direct income support to the poor families without waiting patiently for economic growth to raise their wages and incomes. There is, in fact, growing evidence that various forms of income support, economic redistribution and social security can make a substantial difference to people’s living standards without delay.” In conformity with these views Jean Dreze and Amartya Sen have supported Mahatma Gandhi National Rural Employment Guarantee Scheme (MGNREGS) and Food Security Bill enacted in India to help the poor directly by offering them guaranteed employment and subsidised food.
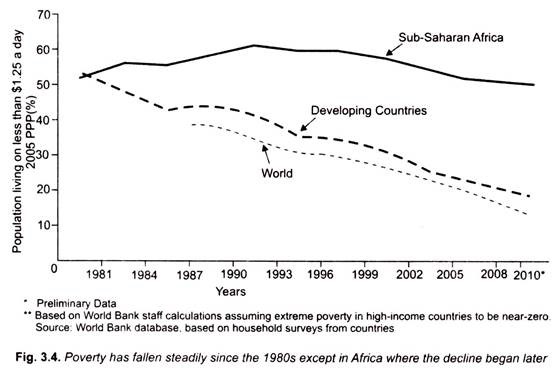
In the last three decades there has been substantial decline in poverty in the developing countries (including India). China alone accounted for more than half of the total reduction in global poverty between 1980 and 2000. Between 1981 and 2010 when the number of extreme poor in the world declined, the proportion of the poor in East Asia and Pacific (including China) fell from 57 per cent to 20 per cent. However, in sub-Saharan Africa and South Asia reduction in poverty in two decades (1981-1999) has been quite disappointing.
In sub Saharan Africa in the first decade of 21st century (2000-2010) reduction in poverty has been quite substantial (Fig. 3.4). Thus extreme poverty in developing countries has declined steadily since 1980 except in Africa where the decline began after 2000. According to World Bank Report referred to above, “More than one-third of countries in Sub-Saharan Africa, many of them fragile and conflict-affected States had an extreme poverty rate of more than 50 per cent in 2010. In 12 countries in Sub-Saharan Africa, the extreme poverty rate is above 60 per cent; in four cases (Burundi, the Democratic Republic of Congo, Siberia and Madagascar) it is above 80 per cent.