In this article we will discuss about the total, average and marginal revenue of a firm.
(a) Total Revenue:
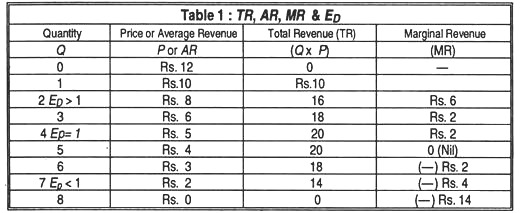
Total revenue is the total sale proceeds or sale-receipts that a firm gets from the sale of its output at a particular price. Tables shows the revenue schedule of a firm.
Let us suppose that the price per unit or average revenue gradually falls as the quantity sold increases (as in the case of monopoly and imperfect competition). In such a situation at first TR increases up to 4 units as within this price-range (from Rs.10 to Rs.5) the demand for the product of the firm is elastic. Within this price-range, TR (what is nothing but the consumer’s expenditure as outlays) increases as the quantity sold increases.
ADVERTISEMENTS:
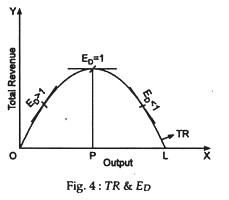
But TR remains constant and becomes maximum within the price-range Rs.5 and Rs.4 (i.e., in between 4 and 5 units), for here the demand for the product is unitary elastic. Beyond the 5th unit onwards (upto 7th unit) TR falls with the increase in the sales, for here the demand for the product is inelastic. In a hypothetical case TR is shown as zero at the 8th unit when price is zero. So the TR curve looks like inverted U as shown in Fig. 4.
The Fig. 4 shows that the TR curve rises from zero (when q- 0) to a maximum at OP output, and then falling back to zero at OL output (when P or AR= 0).
(b) Average Revenue (AR):
ADVERTISEMENTS:
Average revenue is the per unit revenue from the sale of a commodity. It is found out by dividing total revenue by total output sold. So,
AR = TR/Total output sold (Q) = TR/Q
AR is nothing but the price per unit of a commodity, except under some special cases such as discriminating monopoly. In the example given above, at 6 units of output
ADVERTISEMENTS:
AR = Rs. 18 (TR)/6 units (Q) = Rs. 3.
Similarly, at 5 units AR is Rs. 4, at 4 units it is Rs. 5 and so forth.
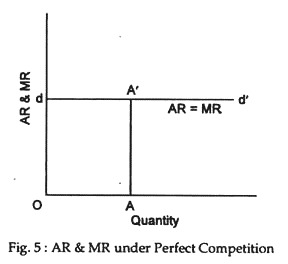
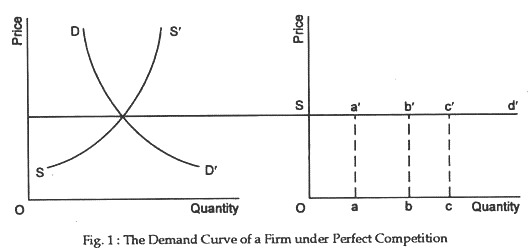
The nature of the AR curve becomes different under the different market conditions. Under pure competition, the price at which an individual firm can sell its product remains the same throughout i.e., at all levels of output; accordingly its price line or the average revenue curve (or the demand curve for its product) becomes a horizontal straight line parallel to the quantity axis (dd’ in Fig. 5).
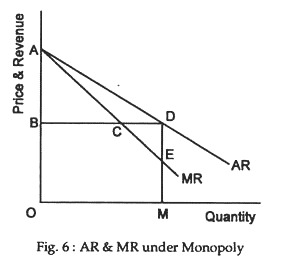
But under monopoly and imperfect competition, the price falls as the supply increases, as a result the price line or the average revenue curve in such a market will be a downward sloping one from left to right (dd’ in Fig. 6).
(c) Marginal Revenue (MR):
Marginal revenue is the additional (or extra) revenue from the sale of an additional unit of output. When a firm’s sales increase (or decrease) by an additional unit, its total revenue increases (or decreases) by a certain amount. This increase (or decrease) in the total revenue resulting from the sale of an additional unit, is called marginal revenue at the level of output.
So, MR is the addition to TR when the sale of a firm is increased by an additional unit. It is defined as the change of total revenue (plus or minus) that comes when we change Q by one unit. It can also be defined as the increase in total revenue associated with an increase in output sold. So,
ADVERTISEMENTS:
MR = ∆ (TR)/∆Q
To illustrate, let us suppose that the price or AR remains unchanged at Rs. 3 at all levels of output of an individual firm, as happen under pure or perfect competition. This point is illustrated in Table 2.
Table 1 shows that when sales increases from 1 unit to 2 units, TR increases from Rs. 5 to Rs. 10. So, here the MR is equal to Rs. 5 (Rs. 10—Rs. 5). Similarly, when sale increases to 3 units, TR is Rs. 5. We also see shows that MR can be obtained by subtraction of successive total revenues. Here, price or AR is assumed to remain constant at Rs. 5 and so P or AR becomes equal to MR. For this reason, under perfect competition when the price per unit remains the same, P or AR = MR. This point is illustrated in Fig. 6.
ADVERTISEMENTS:
Fig.1 shows the average and marginal revenue curves of a firm under perfect competition; dd’ is the average revenue curve. It is a horizontal line, parallel to the OX-axis, indicating the same unit price for all the units of output. As AR = MR, it is also the marginal revenue curve. At OA output, AA’ is both average and marginal revenue.
But under imperfect competition and monopoly, the price at which a firm can sell its output falls with the increase in supply. In such a situation P or AR becomes greater than MR as illustrated in Table 3.
ADVERTISEMENTS:
In Table 3, at 11 units the MR is Rs. 0.90 but here the P or AR is Rs. 1.90. At 12 units, the MR is Re. 0.70 but the P or AR is Rs. 1.80 and so on. It shows that when the P or AR decreases with an increase in quantity, P or AR < MR. It happens so because with fall in the P or AR, the TR from the earlier units becomes smaller. So, at falling P or AR.
