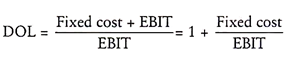
Leverage is defined basically as the firm’s utilization of an asset or liability which requires a fixed payment. It is said that leverage is a double-edged sword.
The types of leverages are:- 1. Operating Leverage 2. Financial Leverage 3. Combined Leverage.
Additionally, learn about the formulas, degree, applications, illustrations and solutions for each type of leverage.
Types of Leverages: Operating, Financial and Combined Leverages
Types of Leverages – Operating Leverage, Financial Leverage and Combined Leverage
The essential element in analysis of the capital structure of the firm is the effect leverage will have on it. Leverage is defined basically as the firm’s utilization of an asset or liability which requires a fixed payment. It is said that leverage is a double-edged sword.
ADVERTISEMENTS:
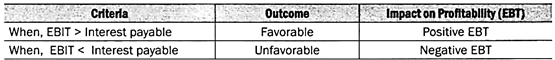
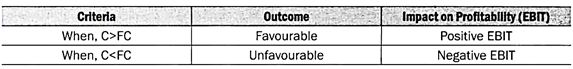
When earnings before interest and taxes exceed the fixed obligations, favorable leverage occurs; when fixed obligations exceed earnings before interest and taxes, unfavorable leverage occurs.
Type # 1. Operating Leverage:
Operating leverage refers to the degree to which operating fixed costs are used in the operations of the firm. The impact of fixed costs on the profit structure of the firm can be judged with the analytical tool of break-even analysis.
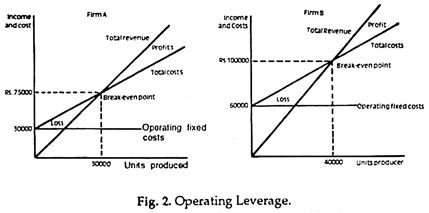
The importance of operating leverage as it relates to profitability can be shown in Figure 2, which considers two firms with different levels of operating leverage. Firm A has fixed costs of Rs.30,000, variable costs per unit of Rs.1.50 and a per unit sales price of Rs.2.50.
At this level of operating leverage, the break-even point is 30,000 units of production. Firm B has the same selling price but a higher level of operating leverage in the form of fixed costs of Rs.60,000.
ADVERTISEMENTS:
The per unit variable costs have been reduced to Re. 1, due in part to the fact that the firm has more automated equipment than firm A. However, at the same level of output where firm A was breaking even, firm B is still losing Rs.15,000. The break-even point for firm B is 40,000 units.
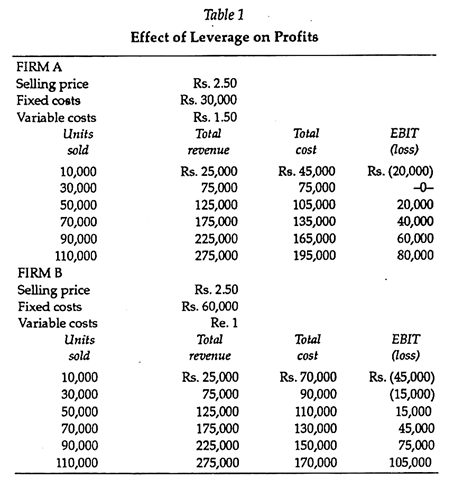
In utilizing more operating leverage, the firm may magnify its profits, but it may also magnify its losses. Table 1 shows the level of profitability at different levels of production for firms A and B. At 10,000 units sold, firm A is losing Rs.20,000, while firm B is losing Rs.45,000.
At an output level of 110,000 units, firm A has a profit of Rs.80,000, while firm B has a profit of Rs.105,000. Increased leverage will magnify profits at high levels of output but will magnify losses at low levels of production. Once a higher level of fixed costs is assumed, it is difficult to eliminate these costs if sales do not reach the expected level.
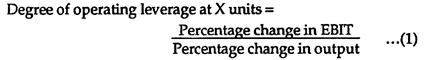
Degree of Operating Leverage:
In addition to examining the impact of operating leverage over a range of outputs, we can also measure the operating leverage effect at a specific level of output. This is called the degree of operating leverage. It measures the impact that operating leverage has on earnings before interest and taxes (EBIT) given a change in output.
This is shown in Equation 1:
Instead of calculating the percentage changes in output and EBIT, we can look at per unit data as given in Table 1 and calculate the degree of operating leverage at a level of output.
This operation is shown in Equation 2:
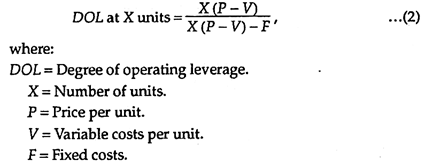
The two equations above show the effect of operating leverage on earnings before interest and taxes. To illustrate the calculating procedure, we can examine the data for firm A and B in Table 1 and calculate the degree of operating leverage at 50,000 units.
This is shown for Firm A as:

At a level of output of 50,000 units, firm A has a degree of operating leverage of 2.5, and firm B has a degree of operating leverage of 5.0. As the level of output changes, so will the degree of operating leverage. The further from the break-even point, the lower will be the degree of operating leverage.
With a degree of operating leverage of 25, if firm A expected to increase its level of output by 10 per cent, Equation 1 indicates that the expected increase in EBIT would be 25 per cent. For firm B, a 10 per cent increase in the level of output would increase EBIT level by 50 per cent. Thus firm B has the higher degree of operating leverage.
The impact of the operating leverage on EBIT will be shown to be even stronger when financial leverage is introduced and the combined leverage effect can be examined.
Type # 2. Financial Leverage:
Financial leverage is defined as the extent to which the firm utilizes limited participating funds obtained at a fixed cost in the hopes of increasing returns to common shareholders.
ADVERTISEMENTS:
Favorable leverage occurs when the firm invests these funds at a return that is greater than the associated fixed cost. Unfavorable leverage occurs when the return on these invested funds is less than the fixed cost.
Impact of Financial Leverage on Earnings per Share:
Any firm that is considering the use of debt or preferred stock in its capital structure must weigh the impact that the increased leverage will have on earnings per share. Management’s object in seeking these funds is to increase the earnings per share. The example below illustrates how debt and stock financing affect this aspect of a company’s financial position.
A company attempting to raise Rs.50 lakhs determines that the funds can be raised through a debt, a preferred stock, or a common stock issue. If the funds are raised through the debt instrument, the firm would pay an annual rate of interest of 7 per cent. If preferred stock is used, the firm would pay an 8 percent dividend. If the funds are obtained through the equity market, 50,000 new shares would be issued at Rs.100 market price.
ADVERTISEMENTS:
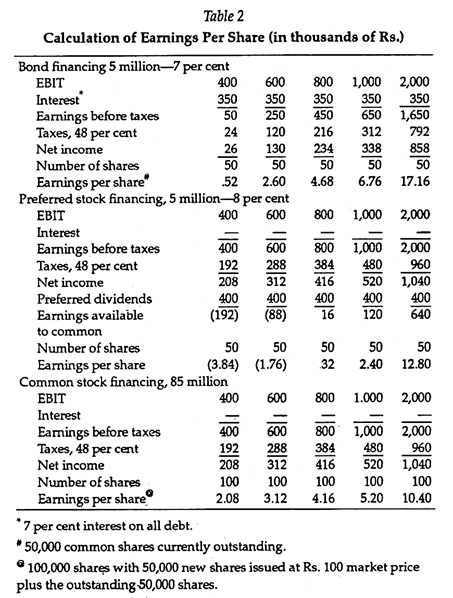
The firm has outstanding 50,000 shares of common stock. Table 2 illustrates the impact of these three financing sources on earnings per share by examining them over different earnings levels.
Given future uncertainty in the economy, the firm estimates that earnings before interest and taxes (EBIT) could vary anywhere from Rs.400,000 to Rs.2 million.
In the debt or bond financing alternative, the 7 per cent interest charges of Rs.350,000 and the 48 per cent tax charge must be deducted before determining the earnings per share (EPS). The EPS will range from 52 paise to Rs.17.16 as the EBIT figure increases.
In the example, it is assumed that this is the only debt outstanding and the firm has outstanding 50,000 shares of stock. With the preferred stock issue, the impact on earnings per share is more volatile because the preferred dividends are paid on an after-tax basis. Thus the earnings per share will vary from a deficit of Rs.3.84 to Rs.12.80.
With the common stock offering, the number of shares would increase to 100,000, and, since there is no interest to deduct, the earnings per share would range from Rs.2.08 to Rs.10.40 as the earnings before interest and taxes increase.
ADVERTISEMENTS:
The table shows that under certain EBIT levels, the earnings per share under the debt financing alternative is larger than under the stock financing alternative, and at high EBIT levels, earnings per share are higher for preferred stock financing than for common stock financing.
This phenomenon can be illustrated in Figure 3 which graphs the relationship between earnings before interest and taxes, and earnings per share for the common stock, preferred stock, and debt financing alternatives.
Note that for all levels of EBIT below Rs.700,000, the common stock financing alternative provides the higher EPS figure, and for all EBIT levels above, this level, the debt alternative provides the highest EPS. The crossover point is called the indifference point. This shows the point at which comparative methods of financing will yield the same results in earnings per share.

To calculate the indifference point between two financing alternatives we equate the two sources of financing, as in Equation 3 and solve for EBIT:
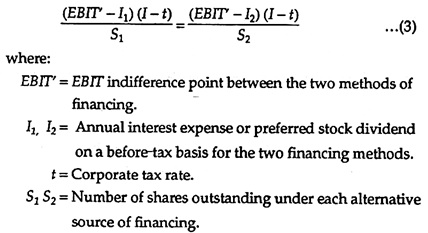
To determine the indifference point, we must know the level of earnings before interest and taxes (EBIT) at which two financing plans will provide the same earnings per share. This level of EBIT will vary with different numbers of common shares outstanding, different amounts of interest, or different amounts of preferred dividends. This is why the EBIT level must be adjusted as shown in the numerator of Equation 3.
ADVERTISEMENTS:
The EBIT level is adjusted by subtracting the interest payments and the before-tax preferred stock dividends and then adjusting this figure for the tax effect. To put this amount on a per share basis, we divide by the number of common shares for each financing plan.
To illustrate this concept, we will examine the common stock and the debt alternatives outlined in Table 2. The debt alternative has an associated interest charge of Rs.350,000 with 50,000 shares of stock outstanding, and the stock alternative had no interest charges associated with it, but the firm would have to issue an additional 50,000 shares.
To solve for the indifference point, we set the two equations equal to each other and solve for EBIT, as shown in Equation 4.
![]()
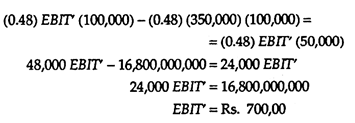
As Figure 3 shows, at an EBIT level below Rs.700,000, the common stock plan provides the higher earnings per share, and at an EBIT level above Rs.700,000 the bond or debt financing plan provides the higher earnings per share. Below the indifference point, the burden of the interest payments is too great in terms of the effect on EPS; thus the common stock financing plan will have higher earnings per share because there is no interest burden.
ADVERTISEMENTS:
At high levels of EBIT the fixed interest charges are more than compensated for, however, because the increased number of shares issued on the stock plan is so great that the earnings available to the common shareholders are spread too thin. The result is a lower level of earnings per share relative to the debt alternative.
For the preferred stock versus the common stock alternative, the indifference point is at the Rs.1.6 million EBIT level. The reason such a level of EBIT is necessary before the preferred stock financing alternative has a higher level of earnings per share is because preferred stock dividends are paid out of after-tax income. The effect is to reduce the earnings per share as compared to the common stock financing plan.
The degree of financial leverage at a particular EBIT level is measured by the percentage change in earnings per share relative to the percentage change in EBIT.
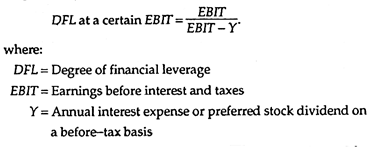
For the debt-financing alternative at an EBIT level of Rs.1 million, the degree of financial leverage would be:
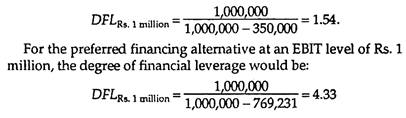
With the debt alternative, a 100 per cent increase in EBIT would lead to a 154 per cent increase in earnings per share. The higher degree of financial leverage associated with preferred stock is due to the higher financial costs on a before tax basis which act as the fulcrum in the leverage analysis.
The double-edged sword concept of financial leverage is dearly demonstrated in this illustration. In periods of high sales and a high EBIT level, the use of debt will magnify the gain to be obtained in earnings per share, compared to common stock or preferred stock financing. The increased earnings per share are the result of the tax effect on the debt interest payments. Because interest is an expense which is deductible before tax, it acts as a tax shield for the corporation.
However, in periods of low sales, the interest charges become a fixed burden for the corporation which severely hurt its EPS record, as shown in Figure 3.
The importance of an accurate sales forecast cannot be stressed enough. If the firm expects a high level of sales and it finances this sales growth through a Rs50 lakhs debt offering, if sales do not reach the level of expectation the firm will face a debt service cost which will impair its EPS record. However, if the firm is correct about the high sales forecast, its profits will be magnified, as shown by the debt line in Figure 3.
Note that the debt line is growing much faster than the stock financing line, indicating the magnification of earnings on both the high and low sides.
This type of analysis is not limited to debt or common stock financing. We can also utilize it in analyzing a combination of debt and equity financing alternatives in order to determine the effect of the various combinations on the earnings per share of the firm.
Impact of Financial Leverage on the Return to Equity Holders:
Increasing the amount of leverage can magnify the earnings per share of the firm, and thus the shareholder’s wealth, when sales are at relatively high levels. The effect on the shareholder’s wealth can be more vividly illustrated by examining the impact of leverage on the return to common equity. In the example below we will ignore the effect of preferred stock financing, to simplify the discussion.
One of the ways to examine the relationship between leverage and the return to common equity, is through the use of the earnings in developing the concept of the return on total assets and the debt to total asset ratio, we defined the return on total assets as net income after taxes as related to total assets.
The effect on the equity holders can be illustrated in Equation 5:
![]()
Assuming that the return on total assets remains constant, the return on common equity can be increased by increasing the debt to total asset ratio, which is the measure of leverage. This will decrease the value of the denominator, which, when divided into the numerator, will increase the return on net worth.
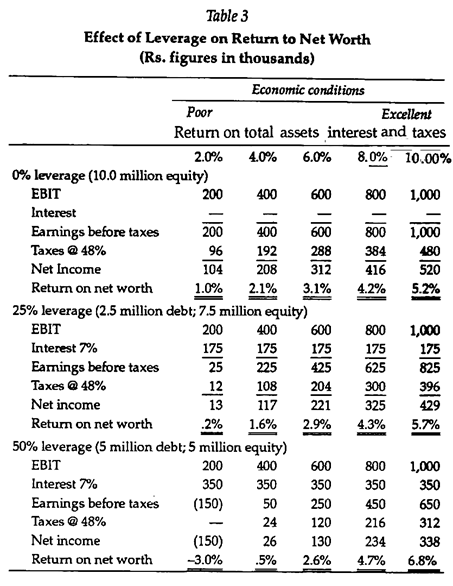
This relationship is further illustrated in Table 3 which considers Rs.10 million asset level and various returns on total assets which reflect different levels of economic activity resulting in poor to excellent sales.
As the sales level increases, the return on total assets also increases, assuming that the relationship of costs to sales and total assets to sales remains the same. In addition, under each return to total asset column, various leverage levels are examined in order to show the impact on the return on net worth.
For example, if a 6 per cent return on total assets before interest and taxes is expected, the return with no (0 per cent) leverage is 3.1 per cent; with 25 per cent leverage, 2.9 per cent; and with 50 per cent leverage, 2.6 per cent. This decrease is due to the earnings not being high enough to absorb the interest cost, resulting in a negative impact on net income available for shareholders.
This is verified in the table, which shows that the return to shareholders decreases as leverage increases at an EBIT level of Rs.600,000. Above the Rs.600,000 level, the return to shareholders increases as the leverage factor increases.
 Note that the double-edged sword is at work again. At low and high levels of profitability; increasing the amount of leverage will magnify the loss potential and magnify the gain potential.
Thus, if the firm forecasts a high sales level and increases leverage to 50 per cent, as measured by the debt to total asset level, it will have the highest expected gain. However, if management is wrong in its forecast, the losses will also be magnified as compared to a lower level of leverage.
Type # 3. Combined Leverage:
Consideration of the combined effects of operating and financial leverage magnifies the effects of leverage on earnings per share. The two leverage factors together increase the dispersion and rid; of forecasting earnings per share.
To measure this combined effect, we can multiply the degree of operating leverage by the degree of financial leverage. This will shows the effect that a change in output will have on earnings per share.
In essence, earnings before interest and taxes is really X (italic P -V)-F, where X is the units of output, P is the price per unit, V is the variable cost per unit, and F is the fixed cost. Thus-
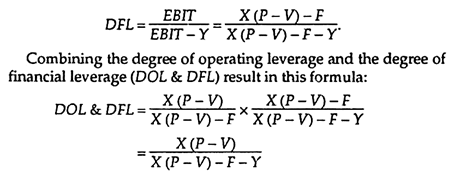
Note that the fixed financial costs, Y, is increase the degree of combined leverage over operating leverage alone.
Types of Leverages – With Problems, Interpretation and Computation
Leverages can be divided into three, i.e.:
1. Operating leverage,
2. Financial leverage, and
3. Combined leverage.
Type # 1. Operating Leverage:
Joy O. M. in his book introduction to financial management has defined operating leverage as “the leverage associated with investment (asset acquisition) activities is referred to as operating leverage.” In simple terms, operating leverage is the tendency of the operating profit to vary with sales. Operating leverage results from the existence of fixed operating expenses, in the firm’s income stream.
The operating expenses can be divided into three:
(a) Fixed Costs:
These expenses do not vary with sales volume, that is, these expenses are a function of time, mostly contractual and must be paid regardless of the amount of sales. For example- salary to staff, rent for the building, etc.
(b) Variable Costs:
These expenses vary directly with the sales volume. For example- materials, labour expenses, etc.
(c) Semi Variable Costs:
Are those which are partly fixed and partly variable. For example- depreciation, telephone charges, etc. It is to be remembered that operating leverage occurs only when fixed costs are to be met, regardless of sales volume. Operating leverage may also be defined as the “firm’s ability to use fixed operating costs, to magnify the effects of changes in sales, on its earnings before interest and taxes.” The earnings before interests and taxes are generally called as operating profits. Let us explain operating leverage with few examples.
A firm sells its products at Rs. 1,000 per unit, has variable operating expenses of Rs. 500 per unit and fixed operating costs of Rs. 5,00,000 per year. Analyse the various levels of EBI that would result from the sale of 1,000 units (b) 2,000 units and (c) 3,000 units.
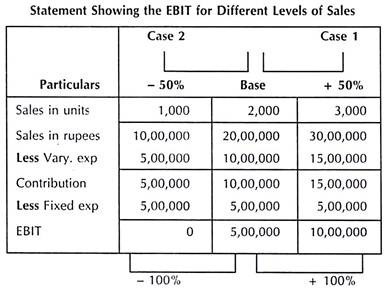
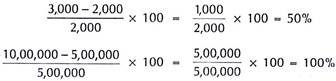
A 50 percent increase in sales (from 20,000 to 30,000 units) results in a 100 percent increase in EBIT (that is, from Rs. 5,00,000 to Rs. 10,00,000), that is –
(b) Case 2:
Similarly in case 2, a 50 percent decrease in sales from (2,000 units to 1,000 units), results in a 100 percent decrease in EBIT (from 5,00,000 to zero).
The example clearly shows that when a firm has fixed operating costs, an increase in sales volume, results in a more than proportionate increase in EBIT. (Case 1). This is known as favourable operating leverage. Similarly from Case 2 it is clear that a decrease in the level of sales, has an exactly opposite effect. This is known as unfavourable operating leverage. Thus leverage works in both directions.
Operating leverage in a firm is affected due to three factors:
(1) The amount of fixed costs,
(2) The contribution margin (that is, sales – variable expenses), and
(3) The volume of sales.
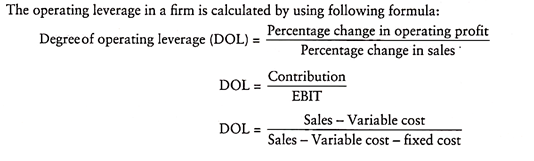
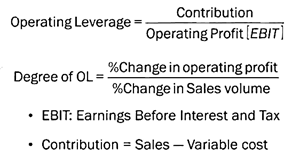
Operating leverage is calculated using the formula –

Degree of Operating Leverage (DOL):
The degree of operating leverage, measures in quantitative terms the extent or degree of operating leverage. It may be defined as “percentage change in the operating profits, resulting from a percentage change in the sales.”
It can be calculated using the following equation:

Since DOL exceeds one, operating leverage exists. It means that for every one percent change in sales, there will be two percent change in EBIT in the same direction in which the sales change. As already pointed out operating leverage exists only when there are fixed operating costs. If there are no fixed operating costs, there will be no operating leverage.
It can be explained with the help of the following example:
Problem – 2:

DOL is one that means there is no operating leverage. It exists only when DOL exceeds one.
Type # 2. Financial Leverage (FL):
Financial leverage is the second type of leverage. It is related to the financing activities of the firm. Financial leverage results from the presence of fixed financial charges in the firm’s income stream. These fixed charges do not vary with the earnings before interest and taxes (EBIT), or operating profits. They have to be paid regardless of the amount of EBIT and after meeting the fixed costs, the remaining operating profits belong to the ordinary shareholders.
Thus financial leverage is concerned, with the effect of changes in EBIT and the earnings available to equity shareholders. Financial leverage may be defined as, “the ability of a firm to use fixed financial charges to magnify the effects of changes in EBIT, on the firm’s earnings per share.” in other words financial leverage or trading on equity involves the use of funds obtained at a fixed cost, to magnify the returns to the equity shareholders.
Financial leverage can be explained with the help of the following example:
H Ltd has an EBIT amounting to Rs. 1,00,000. The firm has five percent bonds aggregating Rs. 4,00,000 and 10% shares amounting Rs. 2,00,000. Calculate the EPS? Assuming the EBIT being (1) 60,000 and (2) Rs. 1,40,000, how would the EPS be affected. The firm is in the 50 percent tax bracket. The number of outstanding equity shares is 1,000.
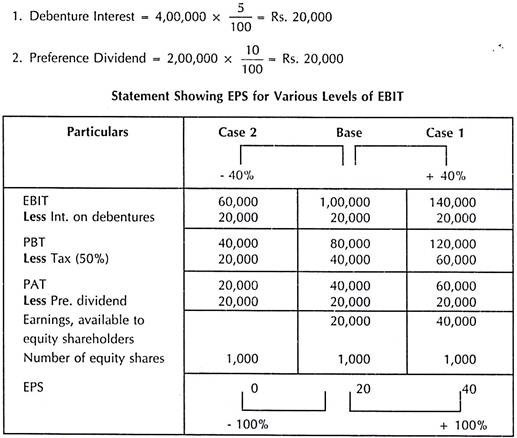
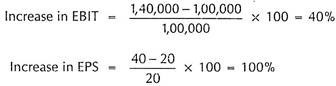
1. In case one, a 40 percent increase in EBIT (from Rs. 1,00,000 to Rs. 1,40,000), results in 100 increase in EPS (from Rs. 20 to Rs. 40)
2. Similarly in case two, a 40 percent decrease in EBIT (from Rs. 1,00,000 to Rs. 60,000), leads to a 100 percent decrease in EPS (from Rs. 20 to 0).
Degree of Financial Leverage (DFL):
DFL measures in quantitative terms, the extent or degree of financial leverage. It can be calculated using the equation –
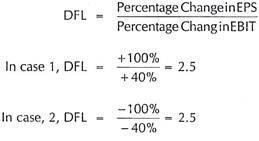
This means that one percent change in EBIT, will cause 2.5 percent change in EPS in the same direction, (that is, either increase or decrease) in which the EBIT changes. As in the case of operating leverage, there will be no financial leverage, if there is no fixed cost financing.
Computation:
Financial leverage is affected due to fixed cost charges. It is calculated using the equation-
Financial Leverage = EBIT/PBT = Earnings Before Interest and Tax/ Profit Before Tax
Significance of Financial Leverage:
High fixed financial costs increase the firm’s financial risk. The financial risk refers, to the risk of the firm not being able to cover its fixed financial costs. EBIT should be sufficient to cover the fixed charges; otherwise it may force the company into liquidation.
Significance of Operating Leverage:
Higher the fixed operating costs, the higher the firm’s operating leverage and its operating risk. High operating leverage is good when sales revenue is high and bad when it is falling. Operating risk is the risk of the firm not being able to cover its fixed operating costs. The larger the fixed operating costs, the larger should be the sales volume to cover all fixed operating costs.
Type # 3. Combined Leverage or Composite Leverage:
Operating leverage has its effects on operating risk and is measured by the percentage change in EBIT, due to percentage change in sales. The financial leverage has its effect on financial risk and is measured by the percentage change in EPS due to percentage change in EBIT. These leverages are ascertaining the firm’s ability to cover fixed charges, (that is, fixed operating costs in the case of operating leverage and fixed financial costs in the case of financial leverage). If we combine them, we get the total leverage and total risk.
Symbolically, CL = OL x FL
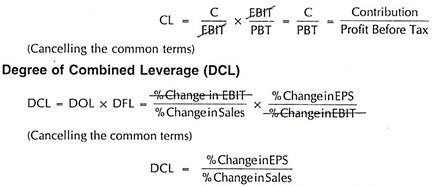
DCL measures the percentage change in EPS, due to percentage change in sales. For example- if the DOL of a firm is 6 and DFL of that firm, is 2.5, then DCL = 6 x 2.5 = 15. That means, one percent change in sales, would bring about 15 percent changes in EPS. Like other leverages, combined leverage also work in both directions – that is, it will be favourable, if sales increases and unfavourable when sales decreases.
Let us explain these leverages with the help of few examples:
A firm sells its products for Rs. 50 per unit, has variable operating costs of Rs. 30 per unit and fixed operating costs of Rs. 5,000 per year. Its current level of sales is 300 units. Calculate the firm’s degree of operating leverage. What will happen to EBIT if sales change? Let us suppose that the sales level (a) rises to 350 units, and (b) decreases to 250 units.

Interpretation:
DOL is six means that for one percent change in sales, operating profit will increase by six percent.
Types of Leverages – With Formulas and Applications
1. Operating Leverage:
The operating leverage is created by a firm through using fixed operating costs in the production. Operating leverage comes into operation when changes in sales bring more than proportionate change in operating profit (EBIT).
According to Solomon Ezra, “Operating leverage is the tendency of the operating profit to vary disproportionately with sales.”
According to John Hampton, “Operating leverage exists when changes in revenue produce greater changes in EBIT.”
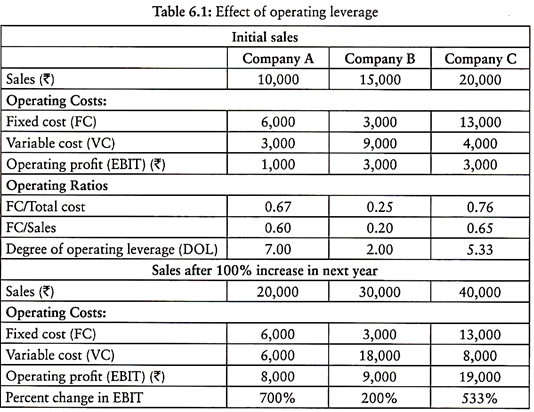
Table 6.1 shows working of operating leverage in case of three firms having varying operating cost structure. In next year, when sales revenue increase by 100%, the operating profits of the three firms increase by varying percentages, i.e. by 700% in case of firm A, 200% in firm B and by 533% in firm C.
This happens because of different operating leverages of the firms. The ratio of contribution to EBIT in a firm indicates its operating leverage. And the contribution depends of presence of fixed costs in the operating cost structure of a firm.
Thus, operating leverage in a firm depends on the following factors:
(i) Fixed costs
(ii) EBIT.
Higher the degree of operating leverage in a firm, higher will be the increase in operating profit for a given change in volume of sales.
In fact, there will be no operating leverage if there are no fixed operating costs. Operating leverage creates ‘operating risk’ or ‘business risk’ in a firm. Business risk is the firm’s inability to meet the fixed operating costs. Higher the fixed operating costs in relation to operating profits, higher is the degree of operating leverage and higher will be the business/operating risk for the firm.
The operating leverage is based on the theory of cost volume profit analysis. The presence of fixed costs in total costs gives birth to operating leverage. However, it would be an error to assume that the firm with largest absolute or relative amount of fixed assets automatically leads to highest degree of operating leverage.
Significance of Operating Leverage:
The knowledge of operating leverage is very useful in deciding sales policy or capital structure of a firm. With the help of operating leverage the manager would know in advance the impact of potential change in sales on the operating profit. Firms may take decision to make some changes in its sales policy or cost structure on the basis of prior knowledge of operating leverage.
Usually, firms do not like to operate under the conditions of a high degree of operating leverage. If a firm operates under a high degree of operating leverage, a small drop in sales may cause operating loss.
Highly automated firms bear a heavy fixed cost and operate under condition of high degree of operating leverage. A small change in sales in such firms may cause huge change in operating revenue.
Applications of Operating Leverage:
The operating leverage can be used to meet the following purposes:
1. Selection of Investment Projects:
The advance knowledge of operating leverage helps in selection of investment projects. If other conditions remain same, the investment project with lower degree of operating leverage should be selected.
2. Selection of Capital Structure:
The capital structure of a firm shows the mix of debt and equity. If the operating leverage of a firm is high, the firm should use low amount of debt in its capital so that in case of loss the burden of fixed interest for the debt could be avoided.
3. Assessment of Operating or Business Risk:
The degree of operating leverage indicates the degree of operating or business risk involved in a firm. This helps a firm in preparing its long-term business/profit policy.
4. Selection of Sales Policy:
The operating leverage helps in advance in determining the impact of change in volume of sales on operating profit of a firm. Having the prior knowledge of such impact, a firm can easily decide its sales policy.
2. Financial Leverage:
Financial leverage is created by use of fixed charge securities in the capitalisation of a firm. Financial leverage is defined as the firm’s ability to use fixed financial expenses in such a way that any increase in operating profit (EBIT) has magnifying impact on the net profit (EPS).
According to Hampton, “Financial leverage exists whenever a firm has debt or other sources of funds that carry fixed charges.”
In the words of Gitman, “The ability of a firm to use fixed financial charges to magnify the effects of changes in EBIT on the firm’s earnings per share is financial leverage.”
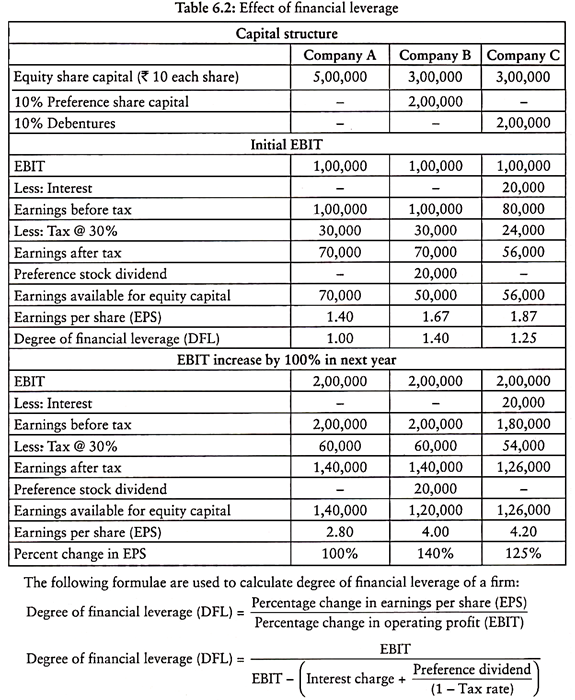
The following example given in Table 6.2 will help in explaining the concept of financial leverage. The three companies A, B and C have different capital mix in the total capitalisation of Rs. 5 lakh. Each company earns operating profit Rs. 1,00,000.
Their EPS are different owning to different proportion of fixed charge securities in the capitalisation. In the next year, operating profit (EBIT) increases by 100% in case of all the three companies. The EPS increases by 100% in case of company A, while it increases by 140% and 125% respectively in case of companies B and C.
This happens due to different degrees of financial leverage in these companies caused by varying proportion of fixed charge securities (debt and preferential shares) in their total capital. Company A has no fixed charge securities in its capital, hence % change in EPS is equal to % change in Operating profit.
Company B has Rs. 2,00,000 preferential share capital and its EPS increased by 140%. Company C has Rs. 2,00,000 debt and its EPS increases by 125%. This shows that the presence of fixed charge securities in capital structure of a firm has magnifying impact on its EPS.
Financial leverage indicates the financial risk involved in the operation of a firm. Financial risk is the risk of a firm’s inability to meet the fixed financial obligations. Higher the proportion of debt in the capitalisation of a firm, the higher will be the degree of financial leverage and the higher financial risk. There is more probability that a firm fails to discharge its financial obligations.
The financial leverage is said to be favourable or positive, when the firm earns more on its investment than what it pays to fixed charge securities in the form of preferential dividend or interest. The surplus after payment of fixed financial charges belong to equity owners.
If the firm earns a return on investment less than the rate at which it pays interest to debt holders, then it negative or unfavourable leverage. In such a situation, firm pays the interest on debt from the profit belonging to the shareholders. In other words, there exists no financial leverage.
If degree of financial leverage is less than 1, there exists no financial leverage. In case the degree of financial leverage is equal to 1, the return on investment is equal to rate of interest payable to debt holders. If degree of financial leverage is more than 1, there exists financial leverage. In this case, return on investment is greater than rate of interest payable to debt holders.
If financial leverage exists in firm, when degree of financial leverage is greater than 1, it is called trading on equity. This implies that the firm’s rate return on investment is greater than the rate of interest payable to debt holders. In this situation, an increase in operating profit of the firm leads to more than proportionate increase in earnings per share.
Importance of Financial Leverage:
Financial leverage signifies the use of debt and preferential share capital for magnifying the profit available to the equity shareholders. A business firm may increase the profit for equity shareholders by increasing the EBIT through the raising of funds from fixed cost sources e.g. debentures, loans and preferential share capital.
The degree of financial leverage helps us to understand how earning per share would change with respect to change in the operating profit. Debt is relatively cheaper source of funds than equity and preferential share capital. The use of debt reduces the overall or weighted average cost of capital of a firm. The reduced overall cost of capital contributes to increased valuation of the firm. This is the basic purpose of financial management.
The degree of financial leverage indicates the financial risk involved in a firm. The knowledge of financial leverage helps in judiciously designing the capital structure of a firm in such a way to reduce the overall cost. The understanding of financial leverage also helps in the capital budgeting of a project.
Applications of Financial Leverage:
The degree of financial leverage in a firm depends on its capital structure. The understanding of financial leverage helps the management of a firm to decide about any change in use fixed cost securities in the total capital of the firm.
The financial leverage is said to be favourable or positive, when the firm earns more on its investment than what it pays to fixed charge securities in the form of preferential dividend or interest.
If the firm earns a return on investment less than the rate at which it pays interest to debt holders, then it negative or unfavourable leverage. In such a situation, firm pays the interest on debt from the profit belonging to the shareholders. In other words, there exists no financial leverage.
If degree of financial leverage is less than 1, there exists no financial leverage. In case the degree of financial leverage is equal to 1, the return on investment is equal to rate interest payable to debt holders. If degree of financial leverage is more than 1, there exists financial leverage. In this case, return on investment is greater than rate of interest payable to debt holders.
If financial leverage exists in firm, when degree of financial leverage is greater than 1, it is called trading on equity. This implies that the firm’s rate return on investment is greater than the rate of interest payable to debt holders. In this situation, an increase in operating profit of the firm leads to more than proportionate increase in earnings per share.
If rate of return on investment is equal to the cost of debt, then the firm should not use leverage. In such a situation, more use of debt capital will increase the financial risk instead of the EPS.
Types of Leverages – With Formulas and Interpretation
A. Operating Leverage:
Most of the business organization incur costs in the process of making profits, these costs are of two types namely, fixed cost and variable costs. Fixed costs are expenses incurred in the course of business that does not change with an increase or decrease in the production and sales volume.
On the other hand variable cost are expenses that vary with organization’s production output and sales volume. From the perspective of business fixed cost remains a concerns as the firm must bear it whether sales and production takes place or not, on the other variable cost may not be an issue of concern because a firms has to bear variable cost according to volume of production and sales. Therefore, Operating leverage is a measure to establish relation between a firm’s fixed cost and variable cost and its impact of profits.
If a firm has high fixed costs and if not able generate sufficient sales revenue then it will not be in a position to absorb fixed costs, this means the firm has high operating leverage which means high business risk. As the volume of sales increases, each new sale contributes reduce the fixed costs and increase the profitability.
Meaning – Operating leverage is the ratio of fixed costs to variable costs.
Definition – Operating Leverage:
According to L. J. Gitman ‘Operating leverage is concerned with the relationship between the firm’s sales revenue and its operating profits (EBIT)’.
Formula for Calculating Operating Leverage (OL):
Interpretation:
A firm with Lower fixed costs and higher/lower variable costs is said to have low operating leverage (business risk) and a firm with High fixed costs and higher/lower variable costs is said to have high operating leverage (business risk). Thus, firms with high operating leverage are very sensitive to changes in sales and it affects their profitability.
B. Financial Leverage:
It determines the impact of using debt financing (debentures and bonds or long term loans) on the earnings of shareholders. Financial leverage is primarily concerned with use of debt capital, a company with a capital structure based largely on debt is required to pay interest to the debt holders, regardless of how the company is performing.
Companies that uses more of debt capital are called highly leveraged and exposed to risk of insolvency if it fails to make payments on debt capital it may also find difficult to borrow funds from new lenders in the future. This risk of failure to pay interest and insolvency is termed as “Financial Risk”.
However financial leverage is not always bad, there are tax advantages associated with debt repayments. Since interest paid on debt capital is deductible from profit and loss account, this result in lower tax liability which in turn increases the earning of the shareholders. Therefore if a firm uses more of debt capital in order to increase the earnings of shareholders it is said to be “trading on equity”. Therefore financial leverage is also termed as “trading on equity”.
Financial Leverage – Definition:
L. J. Gitman defines financial leverage as the firm’s ability to use fixed financial charges to magnify the effects of changes in EBIT on the firm’s earnings per shares.
Financial Leverage – Meaning:
Financial leverage refers to the extent of fixed cost debt capital used by a firm in order to maximize the earning of shareholder, financial leverage is also termed as “trading on equity”.
Formula for Calculating Financial Leverage (FL):

A higher financial leverage signifies use of more fixed cost capital in comparison with equity capital in the capital structure of the company. A lower financial leverage signifies use of less fixed cost capital in comparison with equity capital in the capital structure of the company. Thus, if a firm has sufficient earnings to meet its debt obligation then it is said to have favorable financial leverage and if it does not have earnings to meet its debt obligation it is said to have unfavorable financial leverage.