
In this essay we will discuss about the inequality of incomes in an economy. After reading this essay you will learn about: 1. Causes of Inequality 2. Effects of Inequality 3. Measures to Reduce Inequalities 4. Measurement of Inequality of Incomes.
Content:
- Essay on the Causes of Inequality
- Essay on the Effects of Inequality
- Essay on the Measures to Reduce Inequalities
- Essay on the Measurement of Inequality of Incomes
Essay # 1. Causes of Inequality:
Inequalities of income and wealth are caused by the following factors.
a. Differences in Ability:
People differ widely in education, intelligence, motivation, energy and talent. These differences lead to increased income differentials. A person, who is more efficient than others, gets a higher pay. There may be differences in people having the same qualifications. Some may be more intelligent, hardworking, daring, and resourceful. Thus they may be in a higher scale of social values and earn more in the same occupation.
b. Differences in Age:
ADVERTISEMENTS:
Young persons who enter the job market as fresher’s and old people who retire from service, have lower incomes than those in mid-career.
c. Existence of Non-Competing Groups:
The existence of non-competing groups in every society is another cause of inequalities of incomes.
Prof. Taussig distinguishes five distinct groups:
(i) The unskilled workers like ordinary labourers who carry earth, sand or bricks in construction work;
ADVERTISEMENTS:
(ii) The semi-skilled workers like those who can mix sand and cement in the required proportions;
(iii) The skilled workers who require special training and skills, like the mechanic, the locomotive driver, the plumber, etc.;
(iv) The clerical workers who possess some minimum academic qualification; and
(v) The professional groups such as the lawyer, the teacher, the physician, the actor, and the manager. There are vast income differences in these groups and also within each group. But they are more pronounced in the last group.
d. Differences in Risk, Uncertainty and Security:
ADVERTISEMENTS:
Occupations differ in risk, uncertainty and safety. These differences are reflected in earnings. People prefer government jobs due to greater security. On the other hand, jobs in private organisations carry risk and uncertainty. Employees in government jobs generally earn less than their counterparts in private industries.
e. Differences in Environment and Opportunities:
People who are born, brought up, and educated in well-to-do environment and have better opportunities, generally receive high incomes. On the other hand, children born of poor parents, living in slums, getting bad food, having poor health, and little educational facilities get low income when they grow up.
The vicious circles of such children begin at birth but continue throughout their life. They do not get a fair chance. Poverty breeds a special environment and environment breeds further poverty. Poverty, in turn, erodes income-earning capacities. Thus income inequalities occur because of inequalities of opportunities of education and environment.
f. Immobility of Factors:
Immobility of factors is another cause of income inequalities. A person with the requisite qualifications may not like to move to a high-salaried job in some other part of the country.
Inertia, family and familiar associations, attachment to a particular place, the cost of movement to the new place, and the lack of confidence in adjusting one’s self to the new surroundings are some of the factors which hinder mobility. But a person who possesses some initiative can earn more.
This is possible in the case of horizontal mobility. An unskilled worker can become semi-skilled, and the semi-skilled can become skilled by acquiring some education and training. But the real difficulty arises with the vertical mobility of young person’s coming from the poor families.
The vast income differences to be found between the rich and the poor are due to the fact that relatively very few persons belonging to the poorer sections of the society possess the ability and the opportunity to rise on the social ladder and become rich. In this, luck or chance also plays its part.
g. Regional Disparities:
Income inequalities are also caused by regional disparities. Some regions are backward because of the lack of natural resources or adverse topography and thus fail to provide sufficient employment opportunities to their residents whose incomes remain low compared with persons living in developed regions.
Such regional disparities are to be found in all countries, whether they are developed or developing. For instance, people living in the northern territory of Australia have the lowest per capita income as compared with people living in other states of Australia.
ADVERTISEMENTS:
In India, Punjab and Haryana are the richest in terms of per capita income because of their rapid agricultural development, while Madhya Pradesh, Rajasthan, Jammu and Kashmir, Himachal Pradesh have low per capita incomes due to adverse topography.
h. Inheritance:
The systems of inheritance are found in capitalist societies. It perpetuates rather than causes inequalities of income and wealth. The well-to-do pass on their movable and immovable wealth to their descendants before and after their death.
Thus the heirs of such persons inherit wealth and income without making any efforts, and become “functionless property owners.” But the wiser among the business community expand the inherited wealth and increase their incomes manifold thereby further increasing income inequalities.
The Tata’s, the Birla’s, the Thapars, the Ambanis, the Mohans, the Walchands, the SriRams, the Mafatlals, and the Dalmias in India have tended to increase their empires over the years thereby accentuating income inequalities.
i. Private Property:
ADVERTISEMENTS:
The institution of private property also perpetuates income inequalities in capitalist countries. It is the highly paid who are in a position to save and buy land, property, start some business, or run a factory, or invest in securities, or indulge in speculation.
All such investments give rise to further incomes in the form of rent, profit, or interest. These lead to “considerable inequality both of capital and income, some people have much more than others and some people get much more than others.”
Essay # 2. Effects of Inequality:
Inequalities of incomes and wealth lead to more harmful effects. According to some western thinkers, inequalities of income and wealth lead to rapid economic growth, the urge to become rich motivates people to work hard and earn large incomes and accumulate wealth.
This had been the experience of 18th century England, 19th century Western Europe, and early 20th century Japan where wealth and income inequalities led to large savings on the part of the wealthy classes who used them for productive investments. But the perpetuation of income inequalities is not feasible when all countries are wedded to the idea of ‘welfare state’.
ADVERTISEMENTS:
More so on account of the harmful effects of income and wealth inequalities which are discussed below.
a. Mal-Allocation of Resources:
Inequalities of income and wealth lead to mal-allocation of resources within the economy. The purchasing power of the well-to-do being large, it influences the effective demand of the community. Goods are produced to satisfy the wants and preferences of the upper-income groups.
Thus larger resources are diverted towards the production of articles of comfort and luxury while necessities needed by the masses are neglected. Consequently, there is abundance of the former goods and scarcity of the latter goods. This is a social waste and loss of economic welfare.
b. Wastage of Resources:
Inequalities lead to wastage of resources within the economy. The new rich who own mines, plantations, factories, and business firms earn huge profits. They roll in wealth and spend extravagantly on conspicuous consumption, gold jewellery, palatial buildings, speculation, etc.
On the other hand, the masses live in abject poverty, in extremely insanitary conditions, without any proper medical care. They do not have the means to educate their children. Being ill-fed, ill- clothed, ill-housed and ill-educated, their standard of living is extremely low. So is their efficiency which leads to a huge wastage of the manpower of the economy.
c. Discontentment and Unrest:
Unequal distribution of income and wealth in a society breeds discontentment and unrest among the masses. It divides the country into ‘two nations’, the haves and have- not, or the propertied and the non-propertied. The former exploit the latter in order to earn larger profits or incomes. The factory manager or the landlord does not pay the workers, working either in the factory or on the farm, remunerative wages.
ADVERTISEMENTS:
Rather they adopt labour saving techniques so that less labour is required. This leads to unemployment. All this breeds discontentment and unrest among the working classes which take the form of agitations, strikes, and even violence.
d. Social Injustice:
Income and wealth inequalities lead to social injustice. The few at the top of the income pyramid enjoy all the worldly comforts and luxuries without any efforts, while the teeming millions strive hard to earn a bare living. Such extreme differences between the rich and the masses are socially unjust and undesirable.
e. Concentration of Power:
Inequalities of income and wealth lead to the concentration of economic and political power in the hands of a few rich to the detriment of the entire country. The rich are smart and powerful and unscrupulous. They speculate and manipulate better than ordinary people, they buy politicians and statesmen.
Their share of income reflects this power. They bribe the legislators both directly and indirectly and influence the internal politics and get laws passed in their interests but to the detriment of the common man.
Essay # 3. Measures to Reduce Inequalities:
Since we are concerned with a capitalist society; the measures towards reducing inequalities of income and wealth can be grouped under two heads: (1) To Reduce Incomes and Wealth of the Rich (2) To Raise Incomes of the Low Income Groups.
1. To Reduce Incomes and Wealth of the Rich:
The following measures are suggested towards this end:
ADVERTISEMENTS:
(i) Progressive Taxation:
To reduce inequalities of incomes and wealth, progressive taxes on incomes, wealth, capital gains and profits are essential.
(a) Income Tax:
A progressive personal income tax not only reduces inequalities in the distribution of income but also introduces an element of equity. But care should be taken that the income tax does not adversely affect the incentives to work, save, and invest of the high-income groups.
If the rich indulge in conspicuous consumption, capital flight, hoarding, and in speculation, they should be taxed heavily, and the ‘incentives’ will not be adversely affected. Thus the levy of the tax will decrease the expenditure of the rich on luxuries, while the proceeds of the tax will be utilised to benefit the poor.
(b) Wealth Tax:
ADVERTISEMENTS:
A wealth tax on property is a good supplement to personal income tax. Since the distribution of property is extremely unequal in a capitalist society, proportional property tax would be more progressive than a personal income tax.
It satisfies the criterion of ‘ability to pay’ and discourages the utilisation of savings for the requisition or construction of real property. It is also a most suitable measure for checking the accumulation of property beyond a certain limit.
(c) Capital Gains Tax:
The main objectives for levying a capital gains tax are to reduce the inequalities of incomes and to get rid of certain defects in the personal income tax system. Profits obtained by individuals from the sale of stocks, securities, shares, buildings, land, machinery, plants and other assets give rise to capital gains that are subjected to the capital gains tax.
According to H.M. Groves, “It arises not as a flow of income from the fountain but from the sale of the fountain itself.”
(d) Taxation of Profits:
ADVERTISEMENTS:
Taxation of profits, distributed or undistributed, is meant to reduce large private fortunes in the hands of a very few people. Profits tax should be progressive. But a progressively high rate will have a damping influence on the incentives to save and invest.
It tends to reduce the savings of both the shareholders and the companies, and thus reduces funds available for further investment. It is also possible that employers may concede the demand of trade unions for higher wages, instead of paying large tax amounts. According to Hicks, this is the chief way in which an unduly excess profits tax may minister to inflation.
(ii) Restrictions on Inheritance:
The twin systems of private property and inheritance perpetuate inequalities of income and wealth by enabling property to be transferred to the children of a property owner. Estate duty is lived on the property of a person after his death.
Inheritance tax is imposed on the share inherited by each heir of the deceased person. Thus death duties are very effective in reducing large fortunes. They bring about economic equality and social justice by reducing unequal distribution of wealth.
Death duties do not adversely affect the savings of lower-income groups because they are imposed only on big inheritances. But they reduce the incentive to save and increase the propensity to consume of those persons who accumulate property.
They thus discourage the accumulation of wealth. This acts as a blessing in disguise. Since parents prodearnce and save partly for their children. Death duties encourage larger investment in the health and education of their sons and daughters.
But this is not a correct view according to some economists. Death duties are to be paid in the future not be the person who owns property but by his inheritors. Thus the property owner enjoys his wealth in his life lime. The effect of death duties on the psychology of the owner will be to induce him to save and work more, the heavier the duty is.
Thus death duties serve a useful social purpose by bringing an egalitarian distribution of wealth.
Gift Tax:
A gift tax is a necessary adjunct to an inheritance tax. It is levied to prevent individuals from passing on their property rights to others during their life time. It prevents legal evasion of inheritance tax and is an important source of revenue for the government.
(iii) Prevention and Control over Monopolies:
In capitalist societies, the rich create monopolies in business and trade. They create artificial scarcities, restraint trade, and indulge in speculation and unfair practices. Thus they manipulate to accumulate high incomes through fraudulent means without rendering any service to society.
In order to control such ill-gotten wealth, to prevent monopolies and restrictive trade practices and concentration of economic power in the hands of a few business houses or groups of firms, governments of capitalist countries appoint commissions and pass legislative measures to this effect. In India, there is the
MRTP (Monopolies and Restrictive Trade Practices Act) and FERA (Foreign Exchange Regulations Act.). The United States was the first to pass the Sherman Anti-Trust Act in 1980 and similar acts subsequently. Similar acts have been passed in England, such as the Monopolies and Restrictive Practices Act of 1948 and the Restrictive Trade Practices Act, 1956.
But such Acts serve their purpose to the extent they are implemented properly.
2. To Raise Incomes of the Low Income Groups:
The ultimate aim of all capitalist countries is to establish the Welfare State in which the gap between the top and the bottom of the income scale is to be narrowed. To fulfil this, the rich are taxed and the proceeds are spent for the benefit of the low income groups. The benefits received by the people are broadly of two types, social insurance and social services.
Under social insurance, the participants pay a contribution as a certain percentage of their wage/salary and the remaining amount is contributed by the state and the employers. In return, they receive such benefits as unemployment allowance if they become jobless, sickness benefit, accident and disability benefit, family allowance in case of death, old age benefit, maternity benefit, etc.
Social Services are provided by the government out of the tax proceeds. They include old age, survivorship and disability assistance, medical and hospital assistance, children’s allowance, mid-day meal, milk and cod liver oil to school children, free education, recreation and health centres, parks, etc.
All such social services help raise the real wages/salaries of the working classes. Inequalities of opportunity of education can be removed by providing state scholarships and loans to poor students for the purpose of education by the
Wage-Price Policy:
There is much unfairness, injustice and inequity in the wage structure. Salary/wage differentials are very wide between the lowest and the highest paid workers. They should be narrowed down by proper job evaluation and the introduction of time-scale grades.
But all wage revisions and increases tend to be inflationary Therefore wage increases should be related to productivity. Before this rule is followed, minimum wages should be fixed by law in all occupations and trades.
However, a productivity-oriented wage policy cannot help to increase the wages of workers unless the government adopts a price policy whereby prices are prevented from rising along with wage-increases. This necessitates the adoption of growth-oriented economic policies so that the supply of productive resources is increased and the national product and income rise.
Further, as suggested by Meade, the state should adopt such measures “as the socialisation of monopolistic industries, the fixation of maximum commodity and minimum factor prices and the extension of the work of employment exchanges in making labour more mobile between different occupations.”
Thus the income levels of the low-income groups can be raised by following the ethical principles of ‘equal opportunity’, ‘equal pay for equal work’ and ‘to each according to his wants’ so that in each occupation labour is paid equal to the value of its marginal product.
Essay # 4. Measurement of Inequality of Incomes:
The inequality of incomes is measured by the Lorenz Curve and the Gini Coefficient which are explained below:
1. The Lorenz Curve:
The Lorenz curve is named after an American statistician Lorenz who in 1905 devised it to depict and measure inequalities in the distribution of income. It is used to compare a society’s actual distribution of income among families with an equal distribution. The Lorenz curve is derived by plotting the cumulative percentage of income recipients on the horizontal axis.
Usually, families rather than individuals are represented. On the vertical axis are measured percentages of total national income associated with or received by each percentage of population. It is also cumulated in the same percentages as on the horizontal axis. In Fig. 1 the point marked 20 on the horizontal axis shows the lowest (poorest) 20 per cent of the population; the point marked 40, the lowest 40 per cent, and so on.
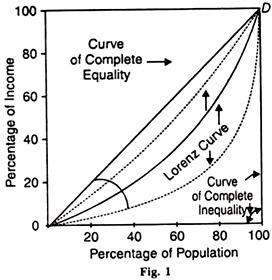
Similarly, the percentages of income on the vertical axis are also marked in the same manner. Thus both the axes have the same length and equal scales and the entire figure is enclosed in a square. If we draw a diagonal line from the origin О and sloping upward from the left to the upper right hand corner D of the square, the curve OD represents complete or perfect equality.
At every point on this 45° diagonal line, the percentage of income received exactly equals the percentage of income recipients. For example, along this line OD, 20 per cent of the population receives 20 per cent of income, 40 per cent of the population receives 40 per cent of income, and so on. But no country exhibits complete equal distribution of income.
The lowest 20 per cent of the population generally receives much less than 20 per cent of income, whereas the highest 20 per cent of the population receives much more than 20 per cent of the income, and so on. This is what the curved line Lorenz curve depicts in the figure.
This curve lies below the 45° line of equal income distribution. The area between this 45° line of equal income distribution and the Lorenz curve reflects the extent of income inequality.
The more unequal the distribution of income, the more curvature there is in the Lorenz curve. If the entire income of the country were received by just one per cent of population and the 99 per cent of the population receives no income, this would be the case of complete or perfect inequality.
In such a situation, the Lorenz curve would be represented by the coexistence of the bottom horizontal axis and the right hand vertical axis. This is depicted in the figure as the thick line running along the horizontal axis and the right hand side of the vertical line.
Since no country has either perfect equality or perfect inequality in its income distribution, the Lorenz curve will lie to the right of the 45° diagonal line. If the degree of inequality is greater, the Lorenz curve will have more bend and will be closer to the bottom horizontal axis, as shown by the dotted curve to the right of the original Lorenz curve in the figure.
On the other hand, if the degree of inequality is less (or there is more equal income distribution), the Lorenz curve will flatten out and move closer to the 45° line, shown as the dotted line to the left of the original Lorenz curve in the figure.
Limitations of the Lorenz Curve:
The Lorenz curve suffers from certain limitations.
1. Not Based on Disposable Income:
The Lorenz curve is based on data relating to money income rather than disposable (spendable) income. It does not take into consideration personal income taxes, social security deductions, subsidies received by the poor families, etc.
Further the data are converted to a per capita basis to adjust for differences in average family size within each quantile (fifth) or decile (each tenth) group of the population. As a result, smaller families may sometimes be shown better off than large ones with greater income.
2. Does not take Life Time Income:
The measurement of income inequality with a Lorenz curve shows income distribution only at a given time. It does not take into consideration lifetime income. For instance, the
income of a cricketer and of a lecturer may be about the same over their lifetimes.
But the income of the lecturer may be spread over a period of thirty five years, whereas that of the cricketer may be realised in 10 years. Therefore, the two incomes are likely to be highly unequal in a given year.
3. Does not Consider Age Differences:
The construction of a Lorenz curve does not take into account the differences in the ages of income recipients. The incomes of young persons who enter jobs recently, that in midcareer and of old people who have retired are not the same. But the Lorenz curve does not distinguish incomes by ages and reflects inequalities across all ages. In reality, the young and the old are concentrated at the low end of the income scale.
It is, therefore, not correct to group the incomes of the people belonging to different age groups for measuring income inequality. Despite these weaknesses of the Lorenz curve for measuring inequality in income distribution, it is still regarded as a useful device.
2. Gini Coefficient or Gini Ratio:
Economists often express the precise degree of income inequality in terms of the Gini coefficient or Gini ratio instead of by the Lorenz curve. The Gini coefficient, named after the Italian statistician C. Gini who formulated it in 1912, is derived from the Lorenz curve diagram.
It is defined as the ratio between the Lorenz curve and the 45° diagonal line to the total area beneath the diagonal line. In other words, the Gini coefficient is the ratio of the inequality area to the total triangular area below the diagonal line.
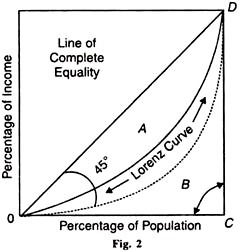
This is shown in Fig. 2 as the ratio of area A over the total area A+B (or DOCD):
Inequality Area/Triangular Area= A/A + B = A/∆OCD
The gini coefficient may vary between zero (perfect equality) and 1 (perfect inequality). As income becomes more equal in a country, the Gini ratio approaches zero. This occurs because the Lorenz curve becomes flatter and approaches the 45° line OD. The area A becomes smaller and smaller and disappears or becomes zero and the value of fraction A becomes zero.
Conversely, as incomes become more unequal, the inequality area, B, grows smaller and smaller. The Lorenz curve approaches the angle С of the triangle OCD and the area В disappears. So the Gini ratio is equal to A/A=1.
Thus the Gini coefficient measures the degree of inequality along a scale from 0 to 1. Countries with a relatively low Gini ratio between 0.2 to 0.35 have relatively equitable income distributions. On the other hand, countries having a relatively high Gini ratio between 0.5 to 0.7 have highly unequal income distributions.
Its Merits:
The Gini coefficient has the following advantages:
1. The Gini coefficient helps us in deriving a coefficient of equality by subtracting the Gini coefficient from 1 as under:
Coefficient of Equality = 1- Gini Coefficient.
2. The Gini coefficient is a better measure of inequality of income distribution than the Lorenz curve because it describes a country’s income distributions by a single number than a series of numbers (percentages of families).
3. Further, the Gini coefficient can be used for the income distribution of smaller groups of people, such as municipalities or states, as against for the entire country in the case of the Lorenz curve.