Some of the methods used for measuring price elasticity of demand are as follows:
1. Total Expenditure Method.
2. Proportionate Method.
3. Point Elasticity of Demand.
ADVERTISEMENTS:
4. Are Elasticity of Demand.
5. Revenue Method.
1. Total Expenditure Method:
Dr. Marshall has evolved the total expenditure method to measure the price elasticity of demand. According to this method, elasticity of demand can be measured by considering the change in price and the subsequent change in the total quantity of goods purchased and the total amount of money spent on it.
Total Outlay = Price X Quantity Demanded
ADVERTISEMENTS:
There are three possibilities:
(i) If with a fall in price (demand increases) the total expenditure increases or with a rise in price (demand falls), the total expenditure falls, in that case the elasticity of demand is greater than one i.e. ED > 1.
(ii) If with a rise or fall in the price (demand falls or rises respectively), the total expenditure remains the same, the demand will be unitary elastic or ED = 1.
(iii) If with a fall in price (Demand rises), the total expenditure also falls, and with a rise in price (Demand falls) the total expenditure also rises, the demand is said to be less classic or elasticity of demand is less than one (ED < 1).
ADVERTISEMENTS:
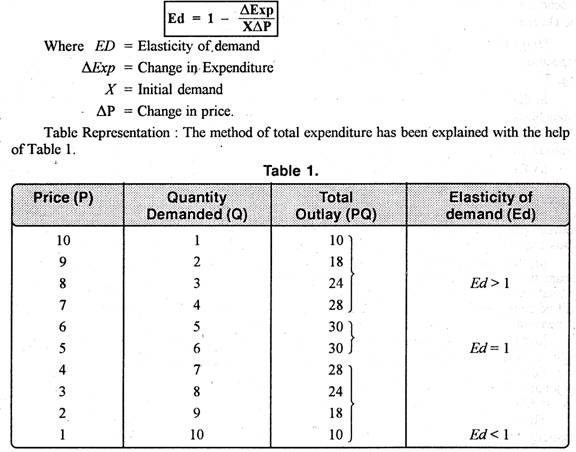
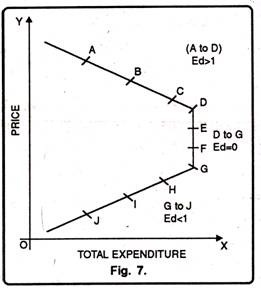
This can be expressed with the help of a Chart.
Leibhafasky has given the following formula to measure elasticity of demand:
In the Table we find three possibilities:
A. More Elastic Demand:
When price is Rs. 10 the quantity demanded is 1 unit and total expenditure is 10. Now price falls from Rs. 10 to Rs. 6, the quantity demanded increases from 1 to 5 units and correspondingly the total expenditure increases from Rs. 10 to Rs. 30. Thus it is clear that with the fall in price, the total expenditure increases and vice-versa. So elasticity of demand is greater than one or ED >1.
B. Unitary Elastic Demand:
If price is Rs. 6, demand is 5 units so the total outlay is Rs. 30. Now price falls to Rs. 5, the demand increases to 6 units but the total expenditure remains the same i.e., Rs. 30. Thus it is clear that with the rise or fall in price, the total expenditure remains the same. The elasticity of demand in this case is equal to one or
ED = 1.
C. Less Elastic Demand:
If price is Rs. 5, demand is 6 and total outlay is Rs. 30. Now price falls from Rs. 5 to Re. 1. The demand increases from 6 units to 10 units and hence the total expenditure falls from Rs. 30 to Rs. 10. Thus it is clear that with the fall in price, the total expenditure also falls and vice-versa. In this case, the elasticity of demand is less than one or ED <1.
Diagrammatic Representation:
The total expenditure can be explained with the help of Fig. 7.
In the fig., there are three phases of the total expenditure curve.
Downward sloping (from A to D), (ii) Vertical (from D to G), (iii) Upward sloping (G to J).
(i) Downward Sloping Curve:
ADVERTISEMENTS:
If the price- total expenditure curve slopes downward from left to right, it means the elasticity of demand is greater than one. As we see in the diagram that when price falls from Rs. 10 to Rs. 5 the total expenditure increases from Rs. 10 to Rs. 30. It means, there is opposite relationship between price and total expenditure. The elasticity of demand in this case is greater than one. Thus the curve from A to D represents the elasticity greater than one or ED >1.
(ii) Vertical Curve.
If price-total expenditure curve is vertical or parallel to 7-axis, it means that with fall in price from Rs. 6 to Rs. 5 the total expenditure remains the same. Thus if total expenditure does not change with the rise or fall in price, the elasticity of demand will be equal to one. Thus by joining points D and G we get vertical curve showing elasticity of demand equal to one or Ed =1.
(iii) Upward Sloping Curve:
ADVERTISEMENTS:
If price-total expenditure curve rises upward from left to right, it means the elasticity of demand is less than one. In the diagram, we find that when price falls from Rs. 5 to Re. 1the total expenditure also falls from Rs. 30 to Rs. 10. It means by joining G, H, I, J we get an upward sloping curve showing elasticity of demand less than one or ED < 1. Thus it is clear that the changes in total expenditure due to changes in price also affect the elasticity of demand.
2. Proportionate Method:
This method is also associated with the name of Dr. Marshall. According to this method, “price elasticity of demand is the ratio of percentage change in the amount demanded to the percentage change in price of the commodity.”
It is also known as the Percentage Method, Flux Method, Ratio Method, and Arithmetic Method. Its formula is as under:
Implications:
(a) This method should be used when there is a very small change in price and quantity demanded.
(b) The coefficient of price elasticity of demand is always negative. It is because when price changes, demand changes in the opposite direction. But by convention, we ignore negative sign.
ADVERTISEMENTS:
(c) The elasticity of demand is relative. It is not expressed in any unit rather expressed in percentage or infractions.
3. Point Method:
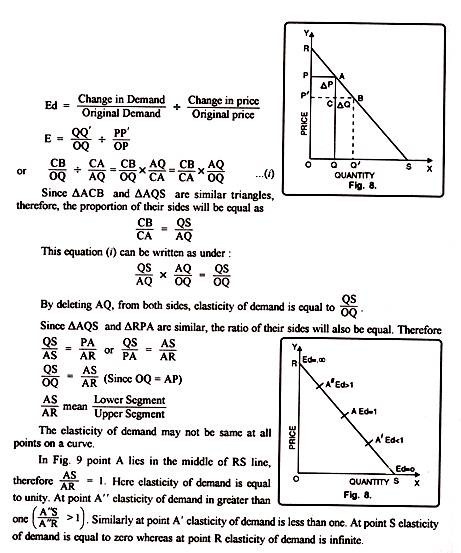
This method was also suggested by Marshall and it takes into consideration a straight line demand curve and measures elasticity at different points on the curve. This method has now become very popular method of measuring elasticity. In this we take a straight line demand curve, which connects the demand curve with both the axes OX and OY. In the diagram OX axis represents the quantity demanded and OY axis represents the price.
Case (i) Linear Demand Curve:
In Fig. 8 RS is a straight line demand curve. Initially, price is OP or QA and OQ or PA is the initial demand. At OP’ new price the demand is OQ’. At point R elasticity of demand can be measured with the following formula.
Case (ii) Non-Liner Demand Curve:
It is possible that the demand curve is not a straight line but a curve. Even then the above technique shall be applicable. The only change to be made is that a tangent is drawn on the demand curve at a point at which we want to measure elasticity of demand.
In Fig 10 DD1 is the demand curve and we raw a line RS to measure the elasticity of demand. At point A demand curve DD1 and RS line touches each other. Therefor, both have same slope. Therefore, a point A, elasticity of demand is Ed = AS/AR
4. Arc Elasticity of Demand:
“Arc elasticity is a measure of the average responsiveness to price change exhibited by a demand curve over some finite stretch of the curve” Prof. Baumol
“Arc elasticity is the elasticity at the mid-point of an arc of a demanded curve” Watson
“When elasticity is computed between two separate points on a demand curve, the concept is called Arc elasticity” Leftwitch
5. Revenue Method:
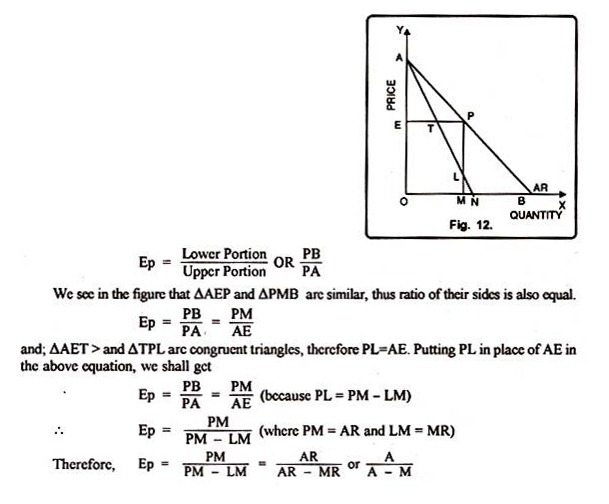
Mrs. Joan Robinson has given this method. She says that elasticity of demand can be measured with the help of average revenue and marginal revenue. Therefore, sale proceeds that a firm obtains by selling its products are called its revenue. However, when total revenue is divided by the number of units sold, we get average revenue.
ADVERTISEMENTS:
On the contrary, when addition is made to the total revenue by the sale of one more unit of the commodity is called marginal revenue. Therefore, the formula to measure elasticity of demand can be written as,
EA = A/ A-M
Where Ed represents elasticity of demand, A = average revenue and M = marginal revenue. This method can be explained with the help of a diagram 12.
In this diagram 12, revenue has been shown on OY- axis while quantity of goods on OX-axis. AB is the average revenue or demand curve and AN is the marginal revenue curve. At point P on demand curve, elasticity of demand is calculated with the formula,
In this way, value of Ep is one which means that price elasticity of demand is unitary. Similarly, if it is more than one, price elasticity of demand is greater than one and if it is less than one, price elasticity of demand is less than unity.


