Neo-classical growth theory refers to general term referring to the models for economic growth developed in a neo-classical framework, where the emphasis is placed on the ease of substitution between capital and labour in the production function to ensure steady-state growth so that the problem of instability found in the Harrod-Domar growth model because of the assumed fixed capital to labour coefficients is avoided.
R. Solow explored the behaviour of the economy as it steadily grows through time In particular, he looked at the relationship between labour growth, capital growth and technological growth and examined whether the growth process has any inherent tendencies to slow down.
Solow wrote a paper in 1956 on balanced growth paths along which the growth rate of capital exactly equals the growth rate of labour, so that the amount of capital available for each worker neither rises nor falls.
As Joan Robinson has put it, “The rate of technical progress and the rate of increase of the labour force govern the rate of growth of output of an economy that can be permanently maintained at a constant rate of profit”. In fact, the long-run growth model was introduced for the first time in that paper.
ADVERTISEMENTS:
Solow’s model is sometimes called the neo-classical growth model because it built on the classical models used by economists before Keynes. The Solow analysis makes extensive use of the production function and a simple assumption about saving.
Saving and Balanced Growth:
In the simplest version of Solow’s neo-classical growth model, the economy is closed (so domestic saving equals investment) and there is no technological change. These two assumptions make it easier to see what is going in a modern capitalist economy. Labour-force growth is assumed to be at a constant rate, n. Each year the labour force increases by n times N, the level at the start of the year.
The change in the capital stock equals net investment. If capital is to grow at the rate, n, then each year capital must rise by the amount nK. In order to stay on a growth path where the capital stock grows at rate, n, net investment must be nK each year.
ADVERTISEMENTS:
We can think of nK as balanced growth investment. For example, if the capital stock is Rs. 10 million and n is 1%, then net investment must equal 1,00,000 times Rs. 10 million if the capital stock is to grow at the same rate as labour.
Here, the first key condition for balanced growth is:
Net investment = nK … (1)
The second major element of Solow’s analysis deals with saving.
ADVERTISEMENTS:
Saving depends on:
(i) The fraction of national income that is saved, and
(2) The level of national income. Lets be the fraction of income that is saved, sY is called the saving time. Saving in the economy is equal to yn times income. Since income equals output, Y, we get
Saving = sY … (2)
For example, if income Y is Rs. 5 million and the saving rate is .02, then saving would be Rs. 1, 00,000. Since saving equals net investment, we see that ysY equals the actual amount of net investment in the economy.
A subsidiary assumption of Solow’s growth analysis is that, the production function has constant returns to scale. Under constant returns and with unchanging technology, if there are equal proportional changes in labour and capital, output changes by the same proportion.
The neo-classical production function expressed is:
Y = F (K, N, T) … (3)
We could divide K, N and Y by any number and the production function would still apply, with constant returns. We choose to divide by N. This has the effect of stating output as output per worker, Y/N, and capital as capital per worker, K/N:
ADVERTISEMENTS:
Y/N = F (K/N, 1, T) … (4)
Example:
Suppose Y = F (K, N, A) = K1/3 N2/3 A. Divide by N to get
Y = (K/N) 1/3. (N/N) 2/3. T = (K/N) 1/3. 1. A = F (K/N, 1, A);
ADVERTISEMENTS:
In other words, we replace K with (K/N) and we replace N with 1 in the production function. Output per worker depends just on capital per worker, since we are assuming that technology, T, is constant over time.
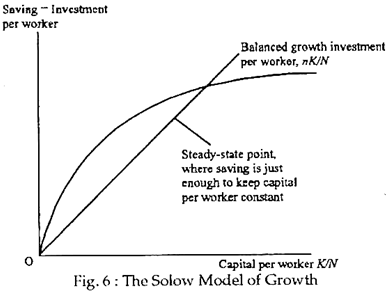
Actual investment can be either greater or less than balanced growth investment. Solow developed a famous diagram to explain what happens in the two cases. The diagram is shown in Fig. 6.
It shows the amount the economy saves per worker (the curving line), and the amount of investment per worker needed to keep the capital stock growing at the same rate as the labour force (the straight line). The steady state occurs at the intersection where saving generates just the right amount of investment to stay on the balanced growth path.
ADVERTISEMENTS:
If capital per worker is less than the steady-state level, investment exceeds the amount needed for balanced growth, and the amount of capital per worker rises. Hence, the economy tends towards its steady state.
The straight line in Fig. 6 expresses Solow’s conclusion about the amount of net investment needed to keep capital growing at the same rate as labour grows The total amount of net investment is nK, so the amount per worker is nK/N Because the horizontal axis is capital per worker, K/N, the amount of net investment – n times (YK/N) – is a straight line with slope n. The curving line expresses saving-investment Solow’s conclusion about saving per worker. Total saving is sF (K, N, and T), so saving per worker is sF (K, N, T) / N which we can also write as sF (K/N, 1, T). The line is curved because it is a constant (s) times the curved production function.
The intersection of the investment line and the saving curve in Fig. 1 is the steady-state point. At this point, the actual amount of investment, determined by saving, is just the amount needed to keep the capital stock growing at the same rate as labour input is growing. If the economy starts at the steady state, it will stay there.
What happens if the economy starts with less capital per worker? This would correspond to a point to the left to the steady-state point in Fig.6. Saving per worker, and thus actual investment, exceeds the amount needed to keep capital per worker constant.
ADVERTISEMENTS:
Each year capital per worker increases. The economy will gradually approach the steady-state point. Similarly, if the economy starts with more capital per worker than the steady-state amount, capital per worker will decline each year and the economy will approach the steady state.
Solow showed that the growth process is stable. No matter where the economy starts, it will converge over time to the same steady state, with the capital stock growing at the same rate as the labour force.
The Effect of Saving on Growth:
Another important conclusion from Solow’s work is that, in the longer run, the growth rate does not depend on the saving rate. In the steady state, the capital stock and output both grow at the same rate as the labour force. The only factor that matters for the rate of growth of the economy is the growth of labour input. Economies that save more do not grow faster in the longer run.
What then is the impact of increasing the saving rate in the Solow analysis?
Suppose that the saving rate suddenly rises from .02 to .04 and stays there. Then the balanced growth condition is violated with K/Y = 2 s/n = 4. According to Solow’s stability argument, capital will increase more rapidly than labour and because of diminishing returns to capital, the capital-output ratio increases.
ADVERTISEMENTS:
The ratio will continue to increase until it reaches 4 and the economy returns to the balanced growth rate of 1% per annum. There is a transition period, however, during which the growth rate of the economy is greater than the balanced growth rate. Hence, greater saving benefits the economy by raising future GDP, but not by increasing the long-term growth rate, according to the Solow model.
Criticisms:
Much of the criticism of Solow’s and other’s versions of neo-classical growth theory focuses on its aggregate production function. Influential critics, such as Robinson and Kaldor, have argued that the microeconomic concept of the production function cannot be realistically aggregated to an entire national economy. (Samuelson has shown a link between the microeconomic and macroeconomic production function, but it is not general.)
In addition, the flexibility of the neo-classical production function is argued to be unrealistic. Machinery as capital, for example, cannot be reduced in size as the employment of labour increases. Further, the disembodiment of technology from capital is considered to be unrealistic because technological progress Ls intertwined with capital improvements.
Recent work by Romer has extended the neo-classical model so that technology is considered a separate factor of production. Romer considers technology, or knowledge, as the cause of increasing returns to factors, or economies of scale.
Such increasing returns, as illustrated by the high productivity tendencies of the rich countries, cannot be accommodated easily by conventional neo-classical models in which factor prices are determined in the kind of competitive markets associated with constant returns to scale.
ADVERTISEMENTS:
Increasing returns are commonly associated with monopolistic markets rather than competitive ones. Unfortunately, the ‘best’ aggregate production function remains to be decided, and both the two-factor version and its extensions provide good empirical fits with reality.

