In this article we will discuss about Demand Analysis:- 1. Objectives of Demand Analysis 2. Importance of Demand Analysis 3. Laws 4. Functions.
Objectives of Demand Analysis:
According to Dean, demand analysis has four managerial purposes:
(1) Forecasting sales,
(2) Manipulating demand,
ADVERTISEMENTS:
(3) Appraising salesmen’s performance for setting their sales quotas, and
(4) Watching the trend of the company’s competitive position.
Of these the first two are most important and the last two are ancillary to the main economic problem of planning for profit.
i. Forecasting Demand:
Forecasting refers to predicting the future level of sales on the basis of current and past trends. This is perhaps the most important use of demand studies. True, sales forecast is the foundation for planning all phases of the company’s operations. Therefore, purchasing and capital budget (expenditure) programmes are all based on the sales forecast.
ii. Manipulating Demand:
Sales forecasting is most passive. Very few companies take full advantage of it as a technique for formulating business plans and policies. However, “management must recognize the degree to which sales are a result only of the external economic environment but also of the action of the company itself.
ADVERTISEMENTS:
Sales volumes do differ, “depending upon how much money is spent on advertising, what price policy is adopted, what product improvements are made, how accurately salesmen and sales efforts are matched with potential sales in the various territories, and so forth”.
Often advertising is intended to change consumer tastes in a manner favourable to the advertiser’s product. The efforts of so-called ‘hidden persuaders’ are directed to manipulate people’s ‘true’ wants. Thus sales forecasts should be used for estimating the consequences of other plans for adjusting prices, promotion and/or products.
Importance of Demand Analysis:
A business manager must have a background knowledge of demand because all other business decisions are largely based on it. For example, the amount of money to be spent on advertising and sales promotion, the number of sales-persons to be hired (or employed), the optimum size of the plant to be set up, and a host of other strategic business decisions largely depend on the level of demand.
ADVERTISEMENTS:
Why should a business firm invest time, effort and money to produce colour TV sets in a poor country like Chad or Burma, unless there is sufficient demand for it? A firm must be able to describe the factors that cause households, governments or business firms to desire a particular product like a typewriter. It is in this context that an understanding of the theory of demand is really helpful to the practicing manager.
Demand theory is undoubtedly one of the manager’s essential tools in business planning both short run and long run. The objective of corporate planning is to identify new areas of investment.
In a dynamic world characterised by changes in tastes and preferences of buyers, technological change, migration of people from rural to urban areas, and so on, it is of paramount importance for the business manager to take into account prospective growth of demand in various market areas before taking any decision on new plant location (i.e., the place of birth decision of a business firm).
If demand is expected to be stable, big sized plant may have to be set up. However, if demand is expected to fluctuate, flexible plants (possibly with lower average costs at the most likely rate of output) may be desirable.
A huge amount of capital may be required to carry inventories of finished goods. If demand is really responsive to advertising, there may be a strong rationale for heavy outlay on market development and sales promotion.
Demand considerations may directly and indirectly affect day-to-day financial, production and marketing decisions of the firm. Demand (sales) forecasts do provide some basis for projecting cash flows and net incomes periodically. Moreover, expectations regarding the demand for a product do affect production scheduling and inventory planning.
Again a business firm must take into account the probable reactions of rivals and buyers — actual and potential — before introducing changes in prices, advertising or product design. Therefore, for all these reasons, business managers can and should make good use of the various concepts and techniques of demand theory.
Laws of Demand Analysis:
Perhaps one of the most fundamental concepts of economic theory is the Law of Demand. The Law simply describes the inverse relationship between price per unit (the dependent variable) and quantity demanded of a product (the independent variable) per unit of time.
It simply states that all other variables remaining unchanged, as the price of a product (say tea) falls, the quantity demanded (of it) increases. This may, however, lead to a fall in the quantity demanded of coffee. Thus the Law of Demand implies substitutability between products: an increase in the quantity demanded of one commodity is almost always at the expense of another.
ADVERTISEMENTS:
We are focusing on some key concepts of demand analysis, even at the cost of repetition. To a layman demand refers to the desire for a commodity.
For example, we often make such loose statements that the demand for Maruti cars in India is universal. However, such statements are of little significance to an economist whose primary purpose is to give a quantitative expression to the above statement.
Therefore, to an economist the term ‘demand’ refers to the maximum number of Maruti cars that may be purchased by all consumers at a particular price at a particular point of time.
In general, to an economist the term ‘demand’ refers to a specific relationship of various quantities (of a particular product) per unit of time (say a day, a week, a month or a year) to such variable as the price of the product under consideration, income of the buyer(s), prices of substitutes, prices of complements, expected future conditions, seasonal factors, availability of consumer credit and various other factors.
ADVERTISEMENTS:
It is possible to estimate demand relationships for a particular firm or for the whole industry. The basic concepts to be developed in this section are equally applicable to each type of demand, i.e., firm demand and industry demand.
The Law of Demand can be illustrated by a hypothetical table showing alternative combinations of price and quantity demanded of say, Maruti cars. The table is known as the demand schedule. It can also be explained graphically as a line or curve.
In fact, the demand curve is a graphical representation of the demand schedule. The modern approach, however, is to explain the law in terms of a function showing the relation between dependent and independent variables.
Here we propose to explain the law of demand graphically. This is the general convention. This curve simply describes the relationship between the price of a commodity (or service) and the quantity demanded of the same per unit of time.
ADVERTISEMENTS:
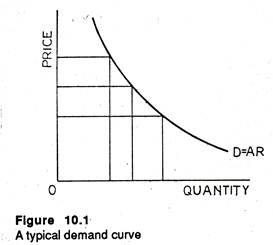
The convention is to express the demand curve for a product on a two-dimensional graph as in Figure 10.1 It may be noted that the term demand refers to the whole demand curve for a commodity while the term ‘quantity demanded’ indicates a particular point on the demand curve.
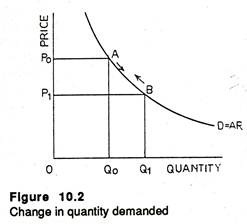
The demand curve also represents the average revenue function for the product. It is because average revenue is the same as the price of a product. The demand curve usually slopes downward from left to the right. This is because the quantity de- the price of a commodity falls (other variables remaining unchanged), the quantity demanded of the commodity increases along the same demand curve from left to right.
The converse is also true. This is shown in Figure 10.2. As a result the total sales revenue (which is the product of price and the quantity demanded) may increase or fall depending on the elasticity of demand for the product under consideration (a concept to be introduced later).
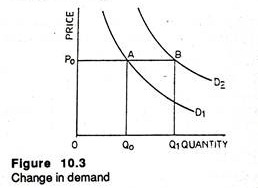
Thus if demand is a function of price: Qd = f (P), changes in quantity demanded are brought about by changes in price of the commodity alone. If, on the other hand, there is a change in any other variable affecting demand, the whole demand curve may shift to a new position as in Figure 10.3.
If the income of the buyer increases, the consumer will buy more of the same commodity even at the same price. This is indicated by point B which is not on the same demand curve. To show a point like B we have to draw a new demand curve D2. This is known as change in demand.
ADVERTISEMENTS:
A change in the price of a related good or a change in the tastes and preferences of buyers is likely to have the same effect. Thus factors other than price are conceived as demand curve shifters — forces that move the price-quantity relationship, left or right. Changes in demand imply such shifts of demand curves.
Functions of Demand Analysis:
i. The Demand Function:
In economic theory the concept of demand is often expressed in an abstract way and economists often make use of the term ‘demand function’ to give a quantitative expression of demand. This function shows the functional relationship between the quantity demanded of a commodity and all factors affecting the demand for the same.
It is usually stated as:
Qd = f (P1, Y, P2, P3, … Pn, A, C, etc)
ADVERTISEMENTS:
Here Qd denotes the quantity, p1 its own price, Y is the income of the buyer, P2……… Pn are the prices of all other goods which are either substitutes or complements, and so on. A is the level of advertising and C denote all other factors affecting demand. For every commodity there is such a demand function. This function has an important property.
It is homogenous of degree zero in prices and income which implies that if all prices and income change in the same direction and in the same proportion, the quantity demanded of no commodity will be altered in the process.
Thus Q in the above equation represents the quantity demanded of a particular product (say baby food) in a particular market (say Calcutta or New Delhi) per unit of time (such as a week or a month) and the other variables represent value of the specified influences (price, advertising, availability of consumer credit and a host of other factors.)
For managerial decision-making it becomes necessary to arrive at quantitative estimates of demand functions. In other words, for taking day-today decisions regarding production, marketing and stock holding managers need quantified estimates of the relationships of quantity to each of the other variables.
A demand equation is a convenient way of giving a quantitative expression of demand. An example of a demand equation is
Q0 = α – β1P + β2A + e
ADVERTISEMENTS:
in which Q is quantity demanded of a commodity and is obviously the dependent variable, P (price) and A (the level of advertising) are independent variables, α, β1 and β2 are the parameters to be estimated. For example, β1 is the change in sales for every rupee change in price. Finally e is the error term, which summarizes the effects of all random variables (chance factors) on demand.
The above demand function specifies a linear relationship of Q to the independent variables. This is at best an approximation and is not a reflection of reality. In the real commercial world the demand function is usually assumed to be curvilinear.
A demand function of this type has the following form:
Q0 = αPβ ,Aβ2. e
in which the variables and parameters have their usual meaning. The assumption underlying the second equation is that the marginal effects of each variable are not constant but rather are dependent upon the numerical value of that variable and of all other influences represented in the demand equation. This equation has constant elasticities.
In fact, the exponential of the variables are the elasticities. This non-linear equation can easily be con- upon the numerical value of that variable and of all other influences represented in the demand equation. This equation has constant elasticities. In fact, the exponential of the variables are the elasticities. This non-linear equation can easily be converted into a linear equation by using logarithms.
ADVERTISEMENTS:
In terms of logarithms the transformed equation may be expressed as:
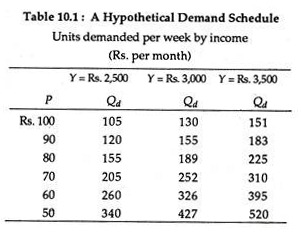
Demand schedules are also made use of to represent quantified demand relationships. The following hypothetical demand schedule shows the associated values of quantity, and the variables affecting quantity.
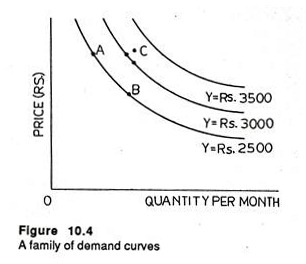
In our example, we show some assumed relationships of quantities to two demand determinants, price and income. It may be noted that “demand schedules are specific for selected points on the demand curve, and they become unwieldy if effects of three or more influences upon quantities are to be handled.”
The information contained in the above table is represented in the form of graphs (Fig. 10.4). Here we get three demand curves for three different levels of income. If price falls quantity demanded increases and is shown by a movement from point A to B along the same demand curve.
In fact the demand curve shows the various quantities that would be demanded at alternative prices, with other variables remaining unchanged. If income increases the quantity demanded of a commodity will go up even at the same price (Compare points A and C). This is shown by a shifts of the original demand curve to a new position.
Demand curves are usually drawn on the assumption that price is the independent variable and quantity the dependent variable. However, in certain real life situations price is the function of quantity.
For example, in the market for staple agricultural commodities like wheat or rice the quantity offered for sale in the current year largely depends on the price that prevailed last year and the current year’s output will be sold out at whatever price it may fetch in the market.
Moreover, in oligopolistic markets prices are administered or managed by the firms themselves. Consider, for example, market for automobiles where prices are largely set by the producers themselves, leaving quantities to be determined by prices and other market forces.
In such situations quantity depends on price. In empirical demand analysis it is of utmost importance to specify at the outset the dependent variables in the demand equation.
Determinants of Demand Functions:
Various factors cause changes in demand and thus shift of the demand curve to a new position.
For example, changes in demand for consumer goods are caused by the following factors:
1. Changes in wages and compensation (bonus, overtime, etc.) of workers and salaried people, changes in rental income and/or interest income, if any;
2. Population growth and consequent changes in the size of the population and its age composition;
3. Changes in government laws, regulations, policies (fiscal and monetary) and procedures concerning consumption of certain harmful or illegal products (like liquors, or LSD)
4. Changes in the kinds and types of products having appeal to consumers. (In fact, the appeal to new goods has always been a powerful factor of economic growth).
Changes in corporate and/or unincorporated business profits also affect demand on the part of business and government buyers.
Likewise the demand for durable goods depends on a host of factors like past purchase of such goods, availability of after-sales service, expectation about future price, possibility of model changes in near future and so on.
ii. The Demand for Durable Goods:
Very few empirical demand studies have so far been made on the durable goods and such goods have not attracted the attention they deserve.
Yet durable goods seem to have attracted excise duties, import tariffs, quantitative trade controls, license fees, and other policy measures far out of proportion to their weight in the national output or expenditure. Housing for instance, is subject to a property (wealth) tax, and the return on business capital, to a corporation income-tax as well.
Moreover, the demand for durable goods fluctuates so violently in comparison with the demand for other sectors’ products, that most modern theories assign it a key role in causing and/or exacerbating business cycles.
Demand Determinants of Durable Goods:
Durable goods present complicated problems of demand analysis. As Joel Dean points out, “Sales of non-durables are made largely to meet current demand which depends on current conditions. Sales of durables, on the other hand, add an increment to a stock of existing goods that dole out their services slowly over several years. It is thus a common practice to segregate current demand for durables in terms of replacement of old products and expansion of the total stock”.
One peculiarity of demand for durables is its volatile relation to business conditions. Since current output of a durable provides only a small fraction of the total current services demanded of that kind of product, sales are highly sensitive to small changes in the demand for the service.
In fact, both replacement demand and expansion demand have various determinants. For example, in case of motor cars replacement demand depends on the value of existing cars as transportation service relative to their value as scrap iron. Thus when expansion demand spurts up suddenly, used – car values usually go higher than scrap values.
Consequently, the scrapping rate and thus replacement demand falls. Dean argues that, “If the public want fewer cars (expansion rate negative), the scrap-page rate must be higher than the level of new car production.
This excess scrap-page is possible if scrap prices are high enough, and the obsolescence price-spread between new and old cars is wide enough
(a) To take the old cars off the road, and
(b) To cover the necessary costs of producing new cars”.
Perhaps the most important replacement determinant is the obsolescence rate, which sets prices in the second-hand markets. On the contrary, the determinants of expansion demand are not different from those for non-durables. In practice, however, a decision to buy a durable good is more complicated, because guesses about the future stand out more sharply in the buyer’s mind.
He worries about future maintenance and operating costs in relation to his future income and other demands. He tries to guess the future sales values and wonders whether prices will rise or fall if he postpones his purchase.
Thus for durable goods, not only present prices and incomes, but their current trends and the state of optimism are proper variables to include in the demand function. So price expectations play a dominant role for any purchase of a large stock of future services; but it is to be called ‘price protection’ and not ‘speculation’.
Again expectorations about improved product designs are also important. New models dry up demand for existing ones and cause price concessions in current models. This is observable in case of television, where the introduction of colour sets has depressed the prices of black and white models.
iii. Durable Goods in Income Statement:
The consumer usually spends part of his disposable income on current consumption expenditures, that is, the expenditures he marks for goods and services consumed during the current period. Although most of the services he consumes are supplied by outside sources, some may be supplied by durable goods such as a house, a car, or a washing machine that he himself owns.
The cost of such self-provided services equals all the current expenses he incurs in operating them, plus whatever depreciation (i.e., loss in value) these goods undergo as a result of wear, tear, and aging during the current period.
It follows that the current consumption entry in the consumers’ income statement should include his expenditures for non-durables, his expenditures for services purchased from outside sources, and the cost of the current-period services provided to him by his own durable goods. His current-consumption entry should not, however, include his current-period expenditure on new durable goods.
iv. Stock Demand Vs. Flow Demand:
Durable goods studies face another problem because of the existence of stock demand and flow demand. At any point in time there is demand for the ownership of houses. There is also the demand for newly constructed dwellings. These two demands are obviously interrelated. Demand must always be considered in relation to supply because both are important in determining the market price of a product (or factor).
v. The Utility Function:
In the words of Joel Dean, “Demand analysis seeks to research and measure the forces that determine sales”. Many factors influence the quantity of a product a business can sell. Some of these are environmental factors, beyond the direct control of the business managers.
Others, however, can be manipulated by the business or managerial economist. What is of interest to us is measurement of demand from a managerial point of view, i.e., in terms of executive decisions that call for demand analysis and the kinds of estimates and forecasts that can be made practically for all industrial products.
Among the environmental (external) factors affecting the level of demand are general economic conditions, consumer tastes and the nature of competition. These are, at best, subject to only indirect influence by a particular business.
Of the variables at the disposal of management in its attempts to influence sales, price is perhaps the most important factor. Other elements in the overall marketing strategy of a business include: expenditure for advertising and other methods of promotion; choice of channels of distribution; and size and method of compensation of the sales force.
Imperfections of Data:
Perhaps the proximate cause of the paucity of durable goods demand studies is to be explained by the difficulty of making them, rather than by any lack of interest in the quantitative relationships they seek to the explore.
Prima facie, the data are far from being ideal because great differences in quality exist among the major durables, and furthermore, there are much greater changes in quality over time in the durables sector than in, say, the basic foods. Price data, too, tend to be shaky in the durable field.
There is another problem on the quantity side. For instance, the market prices of dwelling units at any one time cover an enormous range while the market prices of different bushels of wheat cluster narrowly around their mean.
Moreover, for such items as automobiles and refrigerators, published prices tend to be manufacturers’ suggested list prices, actual transactions prices being clouded from our view by such devices as trade- in allowances, cash discounts, and what not.
vi. Normal Goods and Inferior Goods:
In traditional economics a distinction is often drawn between a normal good and an inferior good. A normal goods is one the demand for which increases with an increase in disposable personal income.
Over the course of a business (trade) cycle, the demand for a commodity produced by a company may rise at increasing rates or fall very little. It is the task of the business (company) economist to relate changes in income to changes in demand for all major products manufactured by the company.
This will enable him (her) to identify at an early stage before acquiring new capital goods and undertaking costly expansion programme those products the demand for which increases with an increase in the income of the buyers.
The demand for some products does fall in reality when income rises, these are called inferior goods. With economic growth national and per capita income will rise and this, in its turn, may imply a fall in the demand for inferior goods in the long-run. For example, when one’s income increases one sells out a small apartment and acquires a big one.
Similarly poor people switch over to fruits and meat from bread and potato when they experience an income increase. However, the same commodity may be a normal good at a particular level of income and an inferior good at a different level of income.
What is of importance to the practicing manager is that aggregate demand and the long-run profitability of an inferior good may well decline, and so production and investment decisions may be taken accordingly.
