In indifference curve map income consumption curve is the locus of the equilibrium quantities consumed by an individual at different levels of his income.
Thus, the income consumption curve (ICC) can be used to derive the relationship between the level of consumer’s income and the quantity purchased of a commodity by him.
A nineteenth century German statistician Ernet Engel (1821-1896) made an empirical study of family budgets to draw conclusions about the pattern of consumption expenditure, that is, expenditure on different goods and services by the households at different levels of income. The conclusions he arrived at are still believed to be generally valid.
According to Engel’s studies, as the income of a family increases, the proportion of its income spent on necessities such as food falls and that spent on luxuries (consisting of industrial goods and services) increases. In other words, the poor families spend relatively large proportion of their income on necessities, whereas rich families spend a relatively a large part of their income on luxuries.
ADVERTISEMENTS:
This change in the pattern of consumption expenditure (that is, decline in the proportion of income spent on food and other necessities and increase in the proportion of income spent on luxuries) with the rise in income of the families has been called Engel’s law.
Though Engel dealt with the relationship between income and expenditure on different goods, in order to keep our analysis simple we will describe and explain the relationship between income and quantities purchased of goods. However, both types of relations will convey the same information about individual’s consumption behaviour as in our analysis of Engel’s curve the prices of goods are held constant.
The curve showing the relationship between the levels of income and quantity purchased of particular commodities has therefore been called Engel curve. In what follows we explain how an Engel curve is derived from income consumption curve. In our analysis of Engel curve we relate quantity purchased of a commodity, rather than expenditure on it, to the level of consumer’s income.
It is worth noting that like the demand curve depicting relationship between price and quantity purchased, other factors remaining the same, Engel curve shows relationship between income and quantity demanded, other influences on quantity purchased such as prices of goods, consumer preferences are assumed to be held constant.
ADVERTISEMENTS:
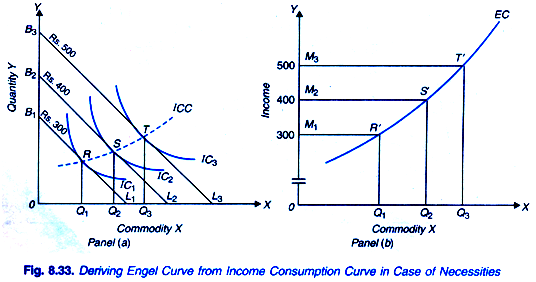
For deriving Engel curve from income consumption curve we plot level of income on the Y-axis and quantity purchased of a commodity on the X-axis. Consider panel (a) in Fig. 8.33. Given the indifference map representing the preferences of a consumer and the prices of two goods X and Y, ICC is the income consumption curve showing the equilibrium quantities purchased of commodities by the consumer as his income increases from Rs. 300 to Rs. 400 and to Rs. 500 per day.
It will be seen from panel (a) of Fig. 8.33 that when income is Rs. 300, given prices of goods X and Y, the consumer is buying OQ1 quantity of the commodity X. In panel (b) of Fig. 8.33 in which level of income is represented on the vertical axis and quantity purchased of commodity X on the horizontal axis we directly plot quantity OQ1 against income level of Rs. 300.
As income increases to Rs. 400, prices of goods remaining constant, the budget line in panel (a) shifts outward to the left to the new position B2L2 with which consumer is in equilibrium at point S and the consumer buys OQ2 quantity of good X. Thus, in panel (b) of Fig. 8.33 we plot quantity purchased OQ2 of commodity X against income level of Rs. 400. Likewise, as income further rises to Rs. 500, budget line in panel (a) shifts to B3L3 and the consumer buys OQ3 quantity of X in his new equilibrium position at T. Therefore, in panel (b) of Fig. 8.33. OQ3 we plot OQ3 against income of Rs. 500.
Thus equilibrium points constituting the income consumption curve in consumer’s indifference map have been transformed into Engel curve depicting quantity-income relationship. Each point of an Engel curve corresponds to a relevant point of income consumption curve. Thus R’ of the Engel curve EC corresponds to point R on the ICC curve. As seen from panel (b), Engel curve for normal goods is upward-sloping which shows that as income increases, consumer buys more of a commodity.
The slope of Engel curve EC drawn in panel (b) of Figure 8.33 equals AM/AQ where AM stands for change in income and AQ for change in quantity demanded of good X and has a positive sign. It is important to note that the slope of the Engel curve in Fig. 8.33 (panel (b)) increases as income increases. This indicates that with every equal increase in income, expansion in quantity purchased of the good successively declines.
This upward-sloping Engel curve with increasing slope as income rises depicts the case of necessities, consumption of which increases relatively less as income rises. For instance, in Fig. 8.33 when income is initially Rs. 300 (= M1) per week, the quantity purchased of the good X equals OQ1 and when income rises by Rs. 100 to Rs. 400 (= Mg2) per week he increases his consumption to OQ2, that is, by quantity Q1 Q2.
Now, when his income per week further increases by Rs. 100 to Rs. 500 per week, the quantity consumed increases to OQ3, that is, by Q2Q3 this is less than Q1Q2. Thus, in Engel curve drawn in panel (b) of Fig. 8.33 quantity purchased of the commodity increases with the increase in income but at a decreasing rate. This shape of the Engel curve is obtained for necessities.
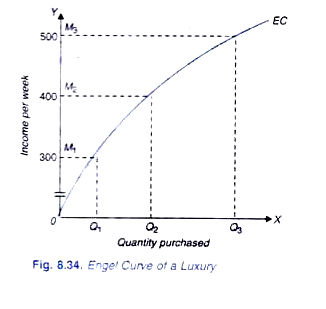
The Engel curve drawn in Fig.8.34 is upward-sloping but is concave. This implies that slope of the Engel curve (∆M/∆Q) is declining with the increase in income. That is, in the Engel curve of a commodity depicted in Fig. 8.34 the equal increments in income result in successively larger increases in the quantity purchased of the commodity. Thus, in Fig. 8.34 at income of Rs. 300 the consumer purchases OQ1 quantity of a commodity.
The increase in income by Rs. 100 to Rs. 400 results in increase in quantity purchased of the commodity equal to Q1Q2. With the further increase in income by the same amount of Rs. 100 to Rs. 500, the quantity purchased increases by Q2Q3 which is much larger than Q1Q2. This implies that as a consumer becomes richer he purchases relatively more of the commodity. Such commodities are called luxuries. Examples of luxuries are air travel, luxury cars, costly woollen suits, air conditioners, costly fruits, etc.
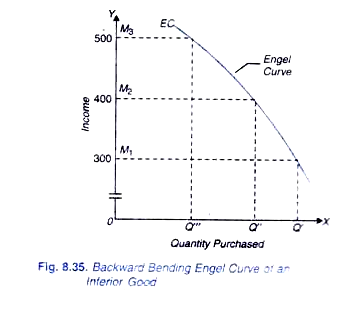
In case of inferior goods, consumption of the commodity declines as income increases. Engel curve of an inferior good is drawn in Figure 8.35 which is backward bending indicating a fall in the quantity purchased of the good as income increases.


