(i) Prior to Independence:
It may be pointed out that during the period 1901 to 1947, agricultural production declined.
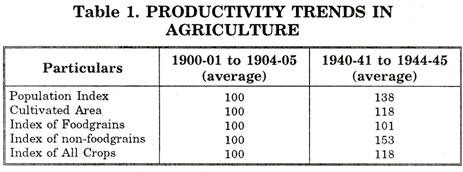
The population rose by 38 per cent while the increase in cultivated area was to the extent of 18 percent. The annual output of food grains and pulses remained almost constant.
Pandse has made a special study of the yield of principal crops in India for the period between 1910-11 and 1945-46 and concluded that the yield per acre of cereals did not show any consistent decline or increase but there was a positive increase in the yield per acre of commercial crops and food-grains. He did not agree with the belief that there had been deterioration in fertility or in the standards of agriculture.
(ii) Post Independence Period:
ADVERTISEMENTS:
The process of decline in productivity has continued in the post-independence period, as compared to the pre-1939 period. The average yield of cereals per acre during 1946-47 to 1949-50 had declined from 619 to 565 lbs. Rangnekar found that the volume of output in India declined from 0.9 metric tones in 1938-39 to 0.86 metric tones per hectare in 1951. Similar conclusion were reached by studies undertaken by ICAR and the Grow More Food Enquiries.
With the introduction of economic planning in 1951 and with the special emphasis on agriculture development, particularly after 1962, stagnant of agriculture was reversed as:
1. There was a steady rise in average yield per hectare.
2. There was a Steady rise in area under cultivation.
ADVERTISEMENTS:
3. Due to increase in area and increase in yield per hectare, total production of the crops recorded a rising trend.
(iii) Trends in Food-grains Production:
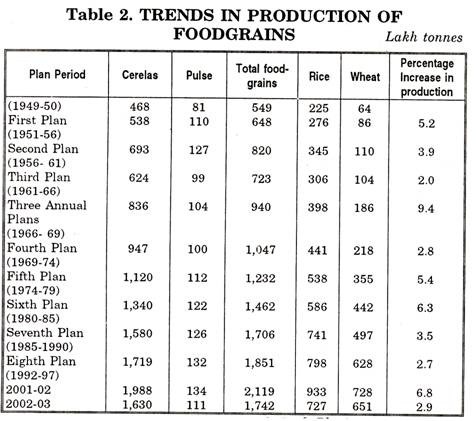
The increase in agricultural production has an important impact on the economic development of a country. In India, the increase in the production of foodgrains has been given in table 2.
It reveals from table 2, that in the last fifty two years food-grains production has increased by about more than three times. The increase in the production of rice was four times while it was over nine times in respect of wheat. Here, it is worth noting that there exists wide variations in the production of food-grains.
ADVERTISEMENTS:
During the course of first two five years plans, the production of food-grains was on the increase but in the third five year plan it has shown a declining trend. Further, in the course of three annual plans, production of food-grains has increased to a great extent. But in the subsequent five year plan periods, the rate of growth of agricultural production was favourable.
According to the first column of the table, the production of cereals was 468 lakh tones in 1949-50 which turned to double i.e. 947 lakh tones in fourth five year plan. During the sixth plan period, its production was recorded 1340 lakh tones and further 1719 lakh tones ending the last year of eighth five year plan.
The production of pulses was registered at 132 lakh tones in 1995-96 which was 110 lakh tones during first plan period. This crop witnessed very deep fluctuations during second and third plan period. Thus, total production of food-grains was recorded 648 lakh tones in first plan period which rose to 1047 lakh tones in fourth plan, 1232 lakh tones in fifth plan, 1462 lakh tones in sixth plan, 1706 lakh tones in seventh plan and 1851 lakh tones in 1995-96.
Regarding trend of rice and wheat, it was 276 lakh tones and 86 lakh tones in first plan which increased to 441 lakh tones and 218 lakh tones in fourth plan and further to 798 lakh tones and 628 lakh tones respectively in 1995- 96. During 2002-03, production of total food-grains 1742 lakh tones, pulses 111 lakh tones, rice 727 million tones and wheat 651 million tones.
This data indicates that production of food-grains has increased considerably over the years but in terms of percentage, increase in production varies from one plan period to another plan period.
(iv) Non-Food Grains:
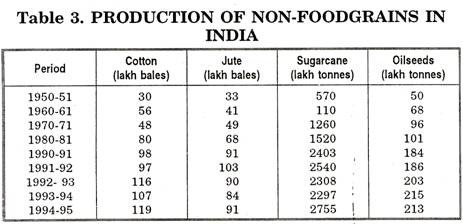
The trends in non-food grains production in India after the introduction of economic planning is shown in table 3.
Table 3 is the evidence that during the course of five year plans, the production of non-food-grains has increased to a great extent. The production of cotton increased by two and a half times, three times of sugarcane, 3.3 times of oilseeds and 1½ times of jute. These crops have a great importance, in the field of international trade.
The production of cotton was 30 lakh bales in 1950-51 which increased to 80 lakh bales in 1980-81, 97 lakh bales in 1991-92 and 131 lakh bales in 1995-96. Regarding jute, its production was 33 lakh bales at the start of first five year plan in 1950-51 which rose to 68 lakh bales in 1980-81, 103 lakh bales in 1990-91 but its production reduced to 89 lakh bales in 1995-96.
ADVERTISEMENTS:
The production of sugarcane has shown upward trend as it was 570 lakh tones in 1950-51, 1520 lakh tones in 1980-81, and 2540 lakh tones in 1991-92. At the close of eighth five year plan, its production was registered at 2829 lakh tones. In case of oil seeds, production was 186 lakh tones in 1990-91 against 50 lakh tones in 1950-51, and 101 lakh tones in 1980-81.
During 1995- 96, the production of oilseeds was recovered 224 lakh tones. Similarly, production of cotton, jute, sugarcane was 87,103 and 2816 lakh tones and production of oilseeds was 151 million tones in 2002-03.
Agricultural Productivity:
The agricultural production depends not only on the area but also on the productivity of land. It shows the relationship between inputs and output.
The agricultural productivity can be classified into two categories viz;
ADVERTISEMENTS:
(A) Agricultural Productivity per worker.
(B) Agricultural Productivity per hectare.
A. Agricultural Productivity per Worker:
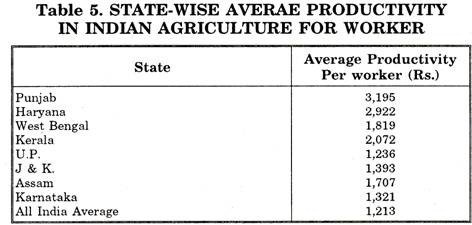
In India, the productivity per worker is not only low but also differs from one state to other as is shown in table 5.
ADVERTISEMENTS:
The above table 5 shows that the labour productivity is only Rs. 1213 per worker on the average for India as a whole. It is Rs. 3195 in Punjab, Rs. 1236 in U.P., Rs. 2922 in Haryana, Rs. 2072 in Kerala, Rs. 1707 in Assam and Rs. 1819 per worker in Kerala.
Per Worker-Agricultural Productivity: International Comparisons:
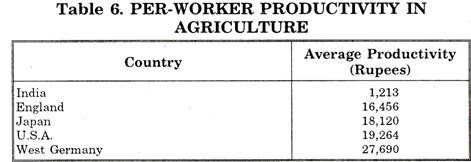
The per worker labour productivity in India is low as compared to some developed countries. According to Dr. Baljeet Singh, “In India per worker productivity forms 1/23 of that of U.S.A. and Japan and 1/21 of that in U.K.” The low level of per-worker productivity is an indicator of backward agriculture. However, a brief presentation of per worker productivity of different countries of the world has been made in table 6.
The above table 6 shows that India’s agricultural productivity per worker is a little more than one thirty fourth of West-Germany and less than one twentieth of England. The stagnation in agricultural productivity has resulted due to the increasing prices of agricultural produce, disapproving many theories of price production complexes and imperfect food distribution. However, productivity per worker for India was Rs. 1,213 while it was Rs. 18,120 for Japan, Rs. 19,264 for USA, Rs. 27,690 for West Germany.
B. Agricultural Productivity per Hectare:
The per hectare productivity has been analysed in two aspects as:
ADVERTISEMENTS:
1. Per-hectare Productivity of Different Crops:
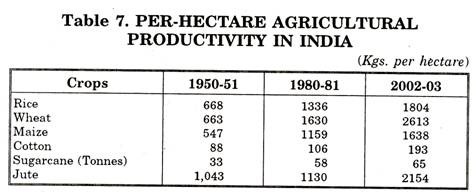
The trend of per hectare productivity of different crops has been analysed in the table 7.
The table 7 indicates that the per hectare productivity of rice in 1950-51 was 668 kgs. per hectare which in 1980-81 increased to 1336 kgs. and further 1804 kg. per hectare in 2002-03. The per-hectare productivity of wheat which was 663 kgs. in 1951 increased significantly to 1630 kg. per hectare in 1980-81 and 2613 kg. per hectare in 2002-03.
For maize, it was 1638 kgs per hectare in 2002-03 against 547 kgs per hectare in 1950-51. The per hectare productivity of sugarcane was recorded to be 65,000 kgs. in 2002-03 against 3342 kgs. in 1951. In case of cotton it rose to 193 kg. per hectare in 2002-03 against 88 kg. per hectare in 1950- 51. Regarding, Jute, it was 1043 kg. per hectare in 1950-51 which increased to 1130 kg. in 1980-81 and further 2154 kg. per hectare in 2002-03.
C. Some International Comparison of Productivity:
No doubt per hectare productivity in India has increased after the introduction of economic planning. But, if we compare it with developed countries it seems to be very low as has been shown in table 8.
The table 8 shows that the per hectare productivity of rice during 2000-01 in India is 1913 kgs. which in Japan is 6410 kgs. and in China it is 6320 kgs. Similarly, the productivity of wheat is 7240 kgs. in France and 7250 kgs. in U.K while in India it is much low i.e. 2553 kgs. per hectare. Similarly, productivity of cotton is very low as compared other advanced countries.
